

Drill down in embedded dashboards
Let your customers click a chart point to open the next level, inside your product.
A viewer clicks a data point and picks Drill into the next level. Each level is one of the metric’s dimensions, in the order the author listed them. Each client still sees only its own rows at every level.
Before you start
- Your company is on the Business plan or higher. Drill down is an authoring feature of those plans.
- You can edit metrics. The default Editor and Developer roles can turn drill down on.
- The metric has 2 or more dimensions and a measure with SUM, AVG or COUNT.
Turn on drill down for a metric
-
Open the metric in the metric builder.
-
Select Drill-down next to the chart type.
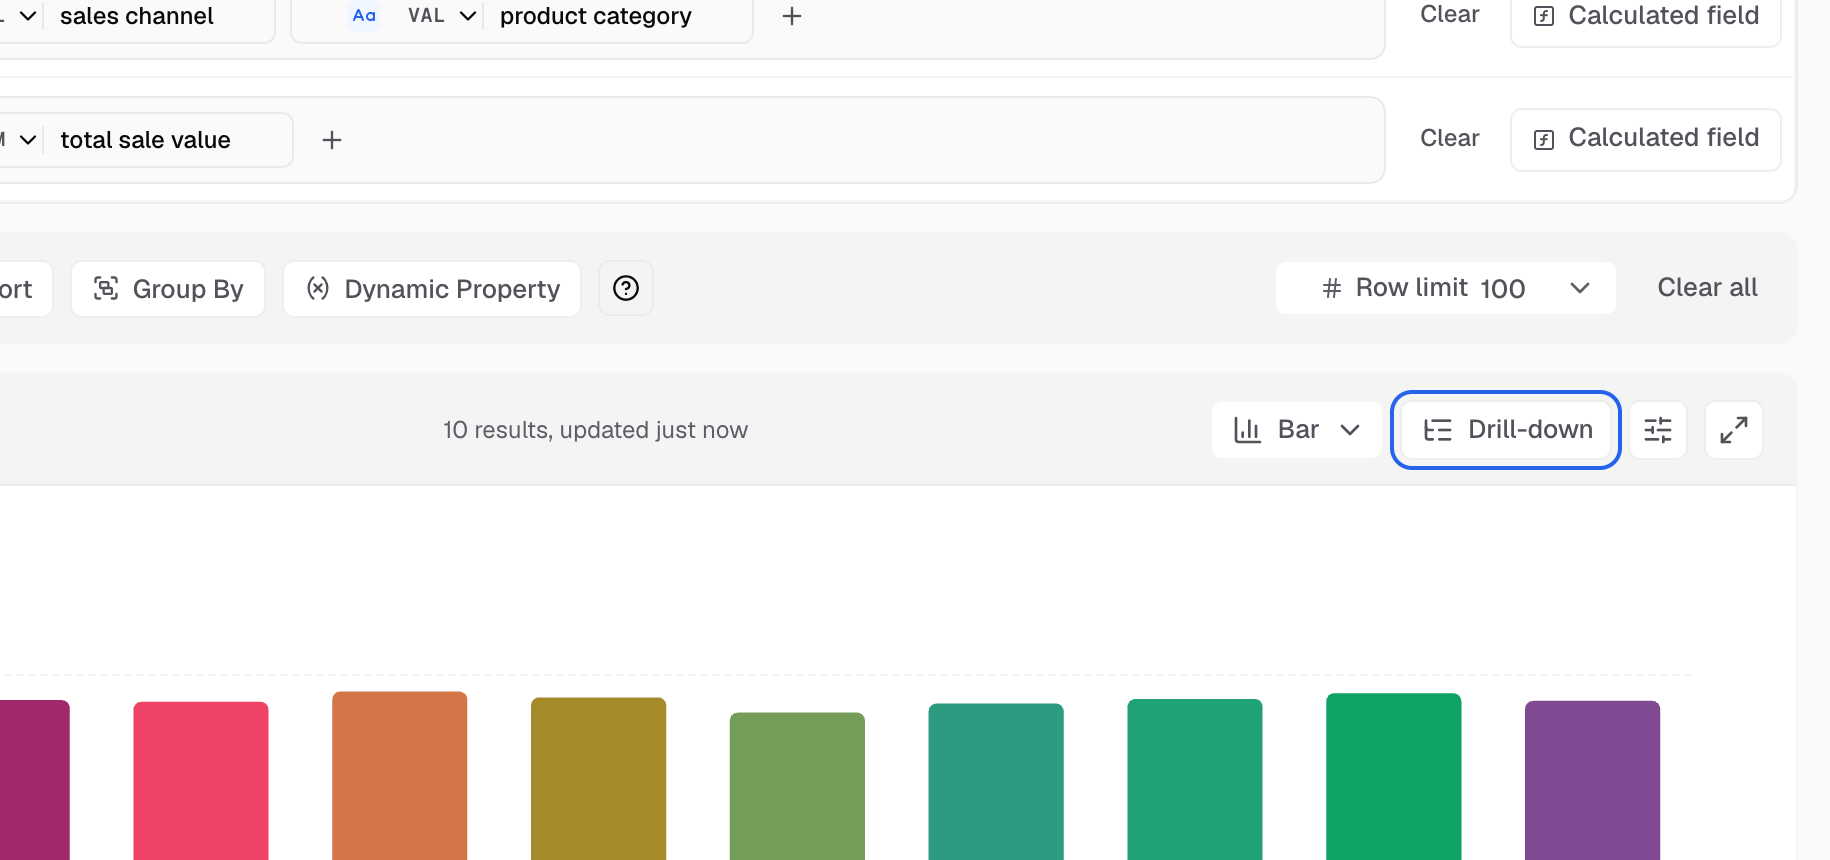
Drill-down appears once the metric has 2 dimensions and a measure. -
Check the Drill levels panel on the left. Level 1 is the first dimension. Rename a level or change its Dimension and Measure.
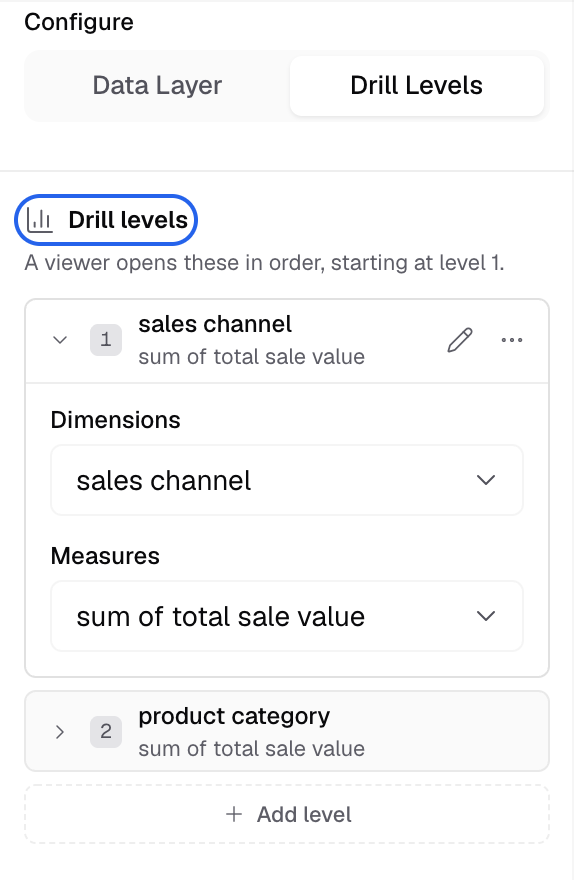
Each level is one dimension. Level 1 is where the viewer starts. -
Save the metric.
You can also turn it on in Chart settings > Actions > Add Actions On Current Card > Drill down. While drill down is on, click actions on the card are off.
Drill down works on 23 chart types, including table, line, bar, stacked bar, area, pie, doughnut, scatter, bubble, tree map and waterfall. Gauges and progress bars do not drill.
Show it in the embed
Add the attributes to the dashboard element:
<dbn-dashboard
  token="GUEST_TOKEN"
  dashboard-id="your-dashboard-id"
  ui-version="v2"
  enable-cross-filter="true"
  enable-adhoc-drill="true"
></dbn-dashboard>| Attribute | What the viewer gets |
|---|---|
enable-cross-filter | Drill into the author’s levels, and a click on a chart filters the other cards |
enable-adhoc-drill | Split by any other dimension the viewer can reach |
The Get snippet dialog adds both attributes when you choose the v2 design. Leave both out to show the chart without drill. <dbn-metric> has no drill attributes.
What the viewer sees
A click on a point opens a menu with the value at the top.
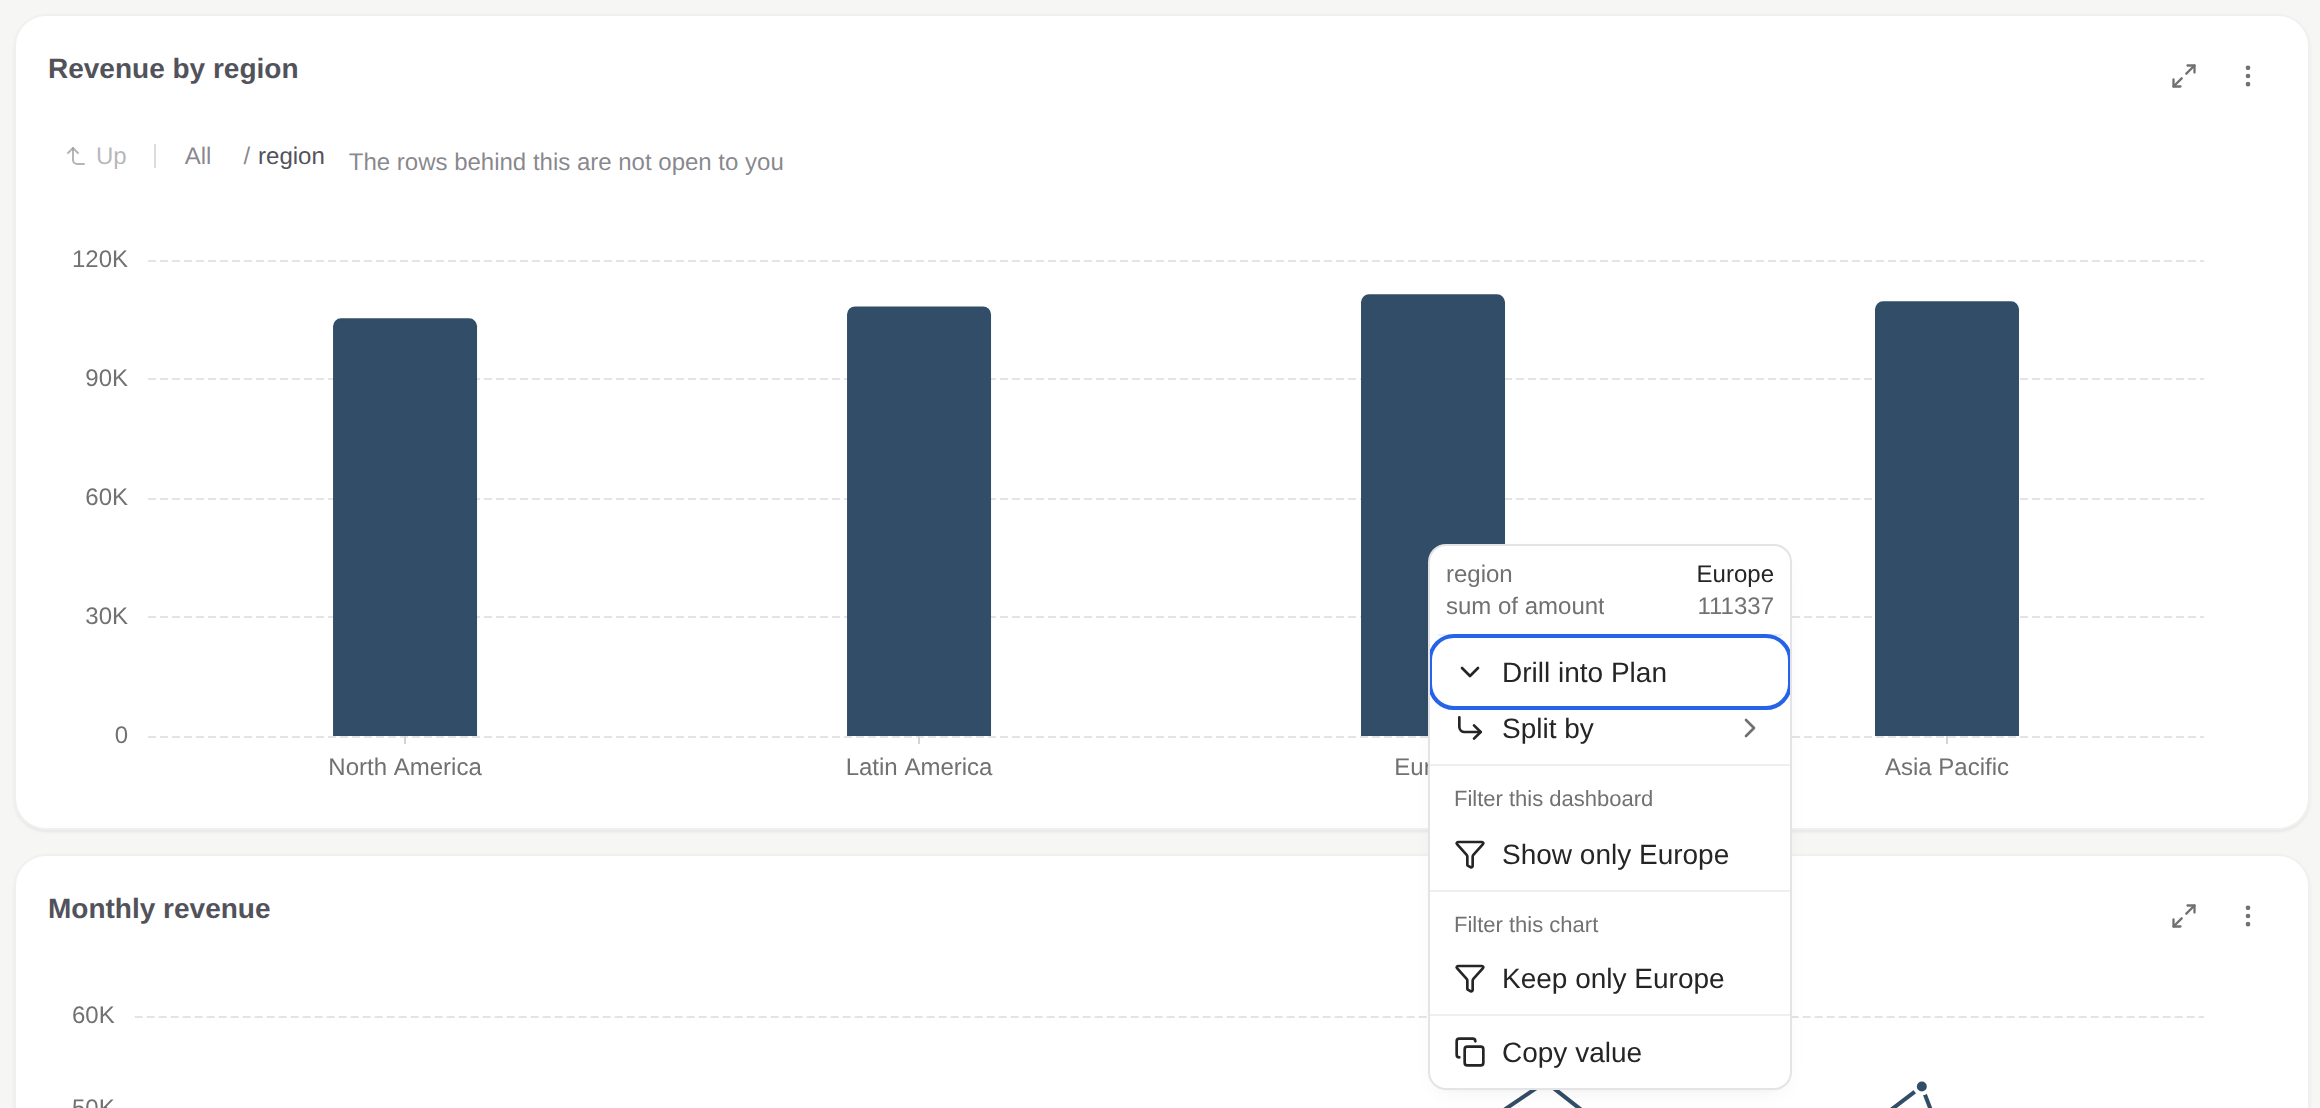
- Drill into the next level is first. The menu names the level, for example Drill into Plan.
- Split by (
enable-adhoc-drill) breaks the point down by another dimension the viewer can reach. - Filter this dashboard: Show only the value on every card. Filter this chart: Keep only the value on this card.
- Copy value copies the value. View underlying data shows only when underlying data is on for the viewer.
- In a table, the dimension cells open the same menu.
After a drill, a breadcrumb above the chart shows the path. Up goes back one level, All goes back to the start, and an earlier crumb jumps to that level.
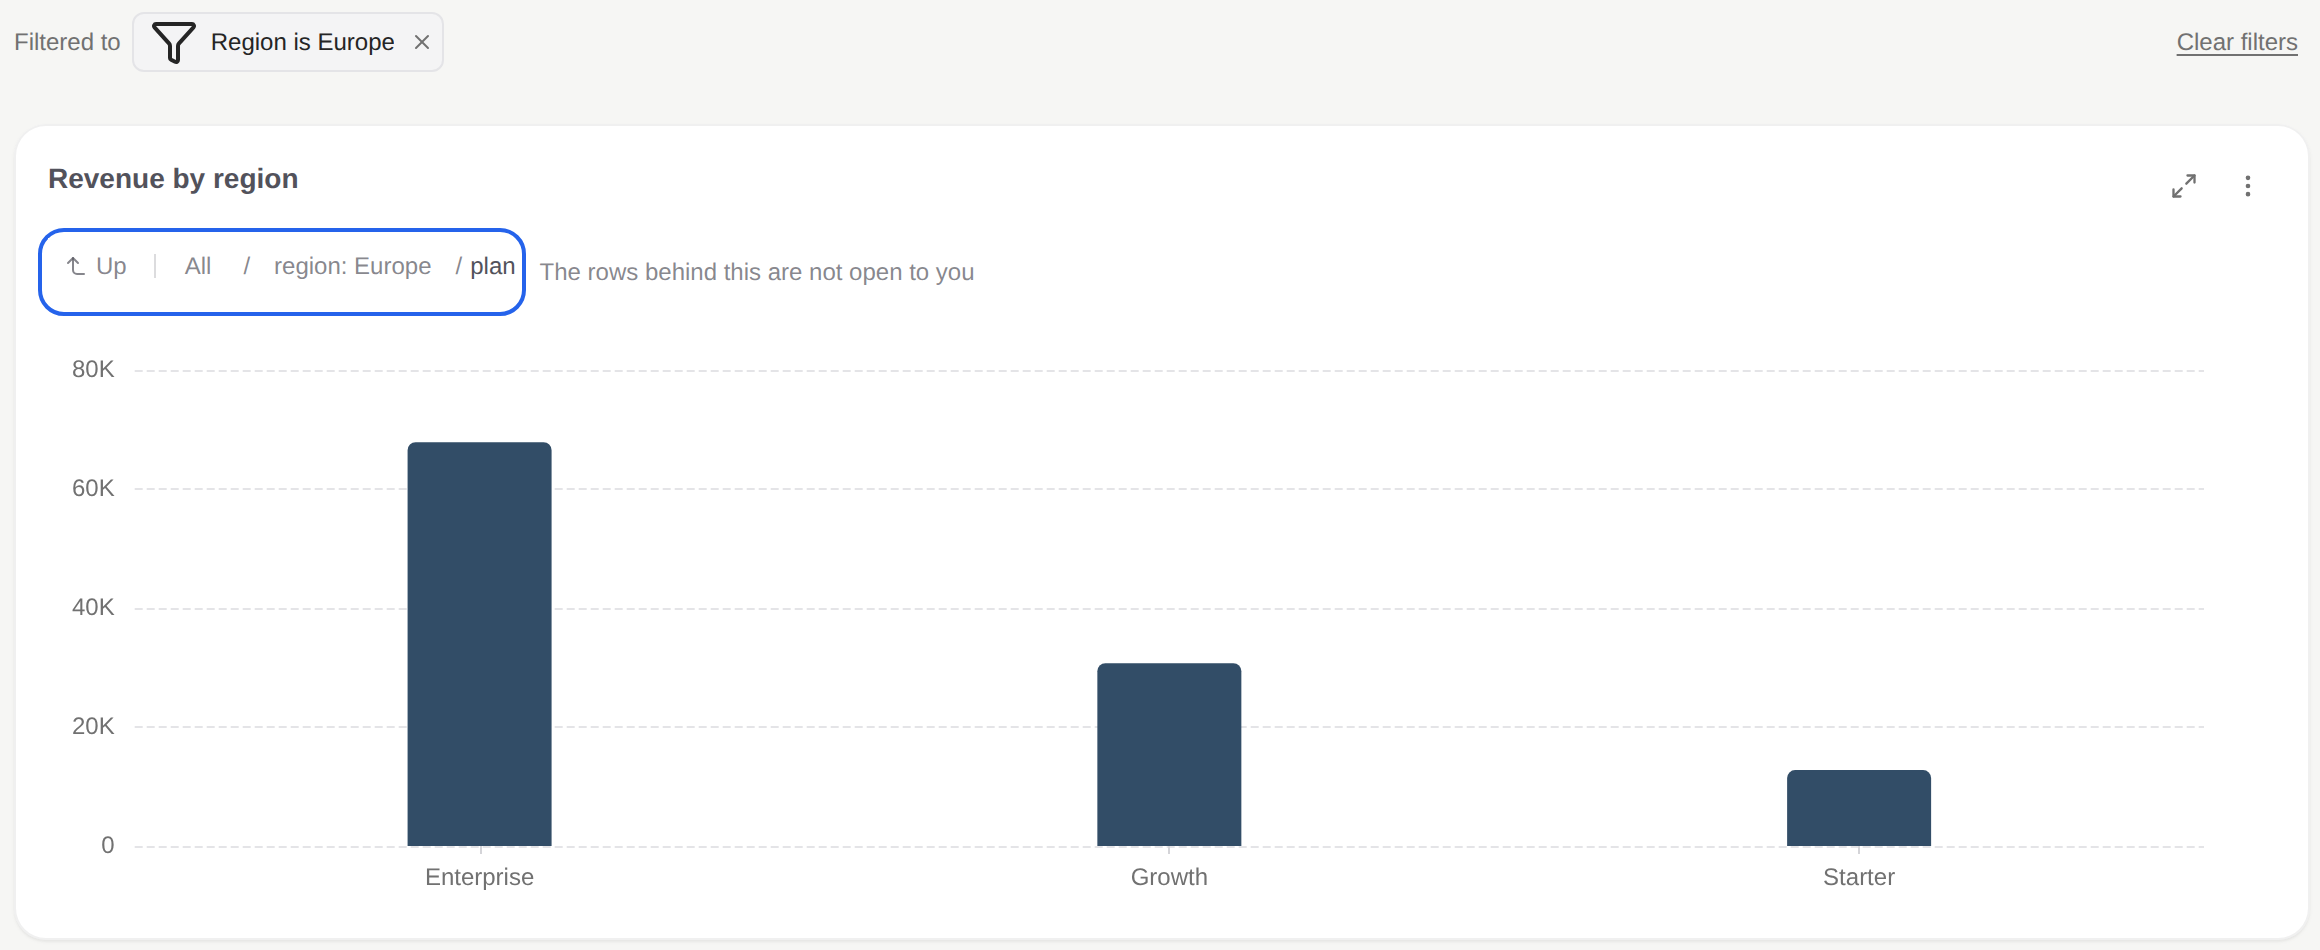
With enable-cross-filter, the drilled value also filters the other cards. The Filtered to bar shows it, and Clear filters removes it.
Tenancy
Drilled queries run through the same client filter as the chart. The guest token fixes the client, and Databrain adds the tenant and row filters to every drilled query. A request for another client is refused.
Next: Drill down in the app.