

Observability & Monitoring
Send traces, metrics and logs to your tool
Turn on OpenTelemetry in a self-hosted Databrain backend and send its data to your monitoring tool.
A self-hosted Databrain backend can send traces, metrics and logs with OpenTelemetry (OTLP). It sends them over OTLP/HTTP only, with no gRPC.
How it fits together
Databrain sends to an OpenTelemetry Collector that you run next to it. The Collector holds your tool’s credentials and forwards the data to SigNoz, Datadog, New Relic, Grafana Cloud, Honeycomb, Elastic or Kloudfuse.
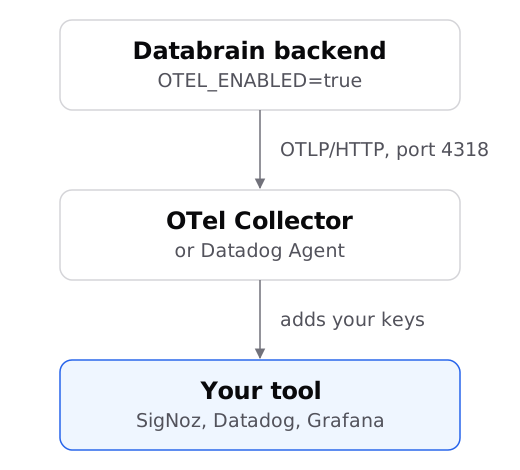
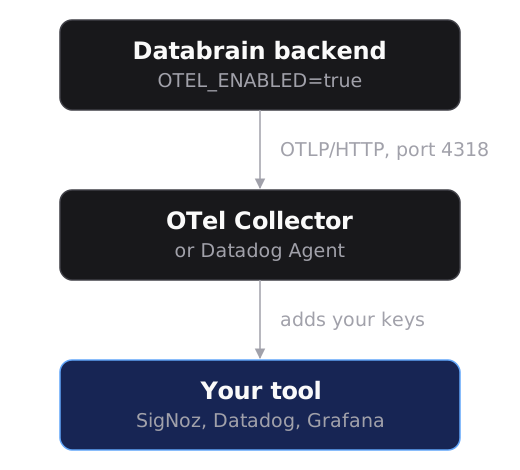
Use a Collector, because Databrain does not add authentication headers to its exports.
Before you start
- You run Databrain on your own servers.
- An OpenTelemetry Collector (the
otel/opentelemetry-collector-contribimage) that the backend can reach on port 4318. Each tool page shows its Collector config.
Steps
-
Set these variables on the backend container:
OTEL_ENABLED=true OTEL_EXPORTER_OTLP_ENDPOINT=http://otel-collector:4318 OTEL_SERVICE_NAME=databrain-api -
Restart the backend.
-
Check the backend log for
[Telemetry] OpenTelemetry initialized - service: databrain-api.
The backend now sends traces to /v1/traces, metrics to /v1/metrics and logs to /v1/logs under that address. Data shows up in your tool within a minute or two.
Settings
| Variable | Default | What it does |
|---|---|---|
OTEL_ENABLED | off | Must be exactly true |
OTEL_EXPORTER_OTLP_ENDPOINT | Base address. Databrain adds /v1/traces, /v1/metrics and /v1/logs. No trailing slash | |
OTEL_EXPORTER_OTLP_TRACES_ENDPOINT | Full address for traces only. Wins over the base | |
OTEL_EXPORTER_OTLP_METRICS_ENDPOINT | Full address for metrics only | |
OTEL_EXPORTER_OTLP_LOGS_ENDPOINT | Full address for logs only | |
OTEL_SERVICE_NAME | databrain-api | The service name in your tool |
LOG_LEVEL | info | error, warn, info or debug. Any other value means info |
With OTEL_ENABLED=true and no address, nothing is sent.
What you get
- Traces for incoming HTTP requests, Express routes, PostgreSQL queries and Redis calls.
- Logs from the backend logger.
- Metrics, sent every 60 seconds:
databrain.http.requests,databrain.db.query.duration_ms,databrain.db.query.cache_eventsanddatabrain.db.query.errors.
Each item carries service.name, service.version and deployment.environment (selfhosted by default).
Telemetry to Databrain is separate
These settings send data only to your own tool. What the backend sends to Databrain is set by DATABRAIN_TELEMETRY:
| Value | Sends |
|---|---|
not set or off | Nothing (the default) |
crash | Crash reports to Databrain, with secrets removed |
analytics | Product usage events to Databrain |
crash,analytics | Both |
off anywhere in the list wins. License updates are another setting. See Manage your license.
If something goes wrong
- No startup line in the log.
OTEL_ENABLEDis not exactlytrue, or no address is set. - The Collector gets nothing. From the backend container, check that the Collector address answers on port 4318. Check that the Collector has an
otlpreceiver withhttpon0.0.0.0:4318. - Traces arrive but no metrics. Metrics leave every 60 seconds. Wait a minute.
- A filter on the
/healthpath matches nothing. The probe paths are/health/liveand/health/ready.