Welcome to Databrain
Connect your data, build dashboards, and share them with your team or embed them in your product.
Databrain is an analytics platform for SaaS teams. You connect your data once, build metrics and dashboards, and then share them inside your company or embed them in your product, with each customer scoped to their own rows.
Your first hour
Step 1: Connect your data
Add a warehouse, a database or a CSV file in Data Studio. Connect data and create a dashboard
Step 2: Build a metric and a dashboard
Pick columns, write SQL or ask Bryn, then save the chart to a dashboard. Create your first metric
Step 3: Make it readable
Add a note and arrange the cards. Customize a dashboard
Step 4: Bring in your team
Invite people with the role they need. Invite users
Step 5: Embed it for customers
Set tenancy, create a data app and paste the snippet. Embedding architecture
Find your way around
The top bar has three areas.
| Area | What you do there |
|---|---|
| Home | Pick a workspace in the sidebar. See its dashboards under All dashboards and its charts under Metrics. Start with Explore data, New dashboard or New metric. |
| Data Studio | Connect datasources, model your data and ship data apps. Overview shows the pipeline for the workspace you pick. |
| Settings | Your profile, your company, people and roles, security, tokens, theming and embed settings. |
To jump to a page, a setting or a workspace setting, select Search or press ⌘K (Ctrl K on Windows).
Home
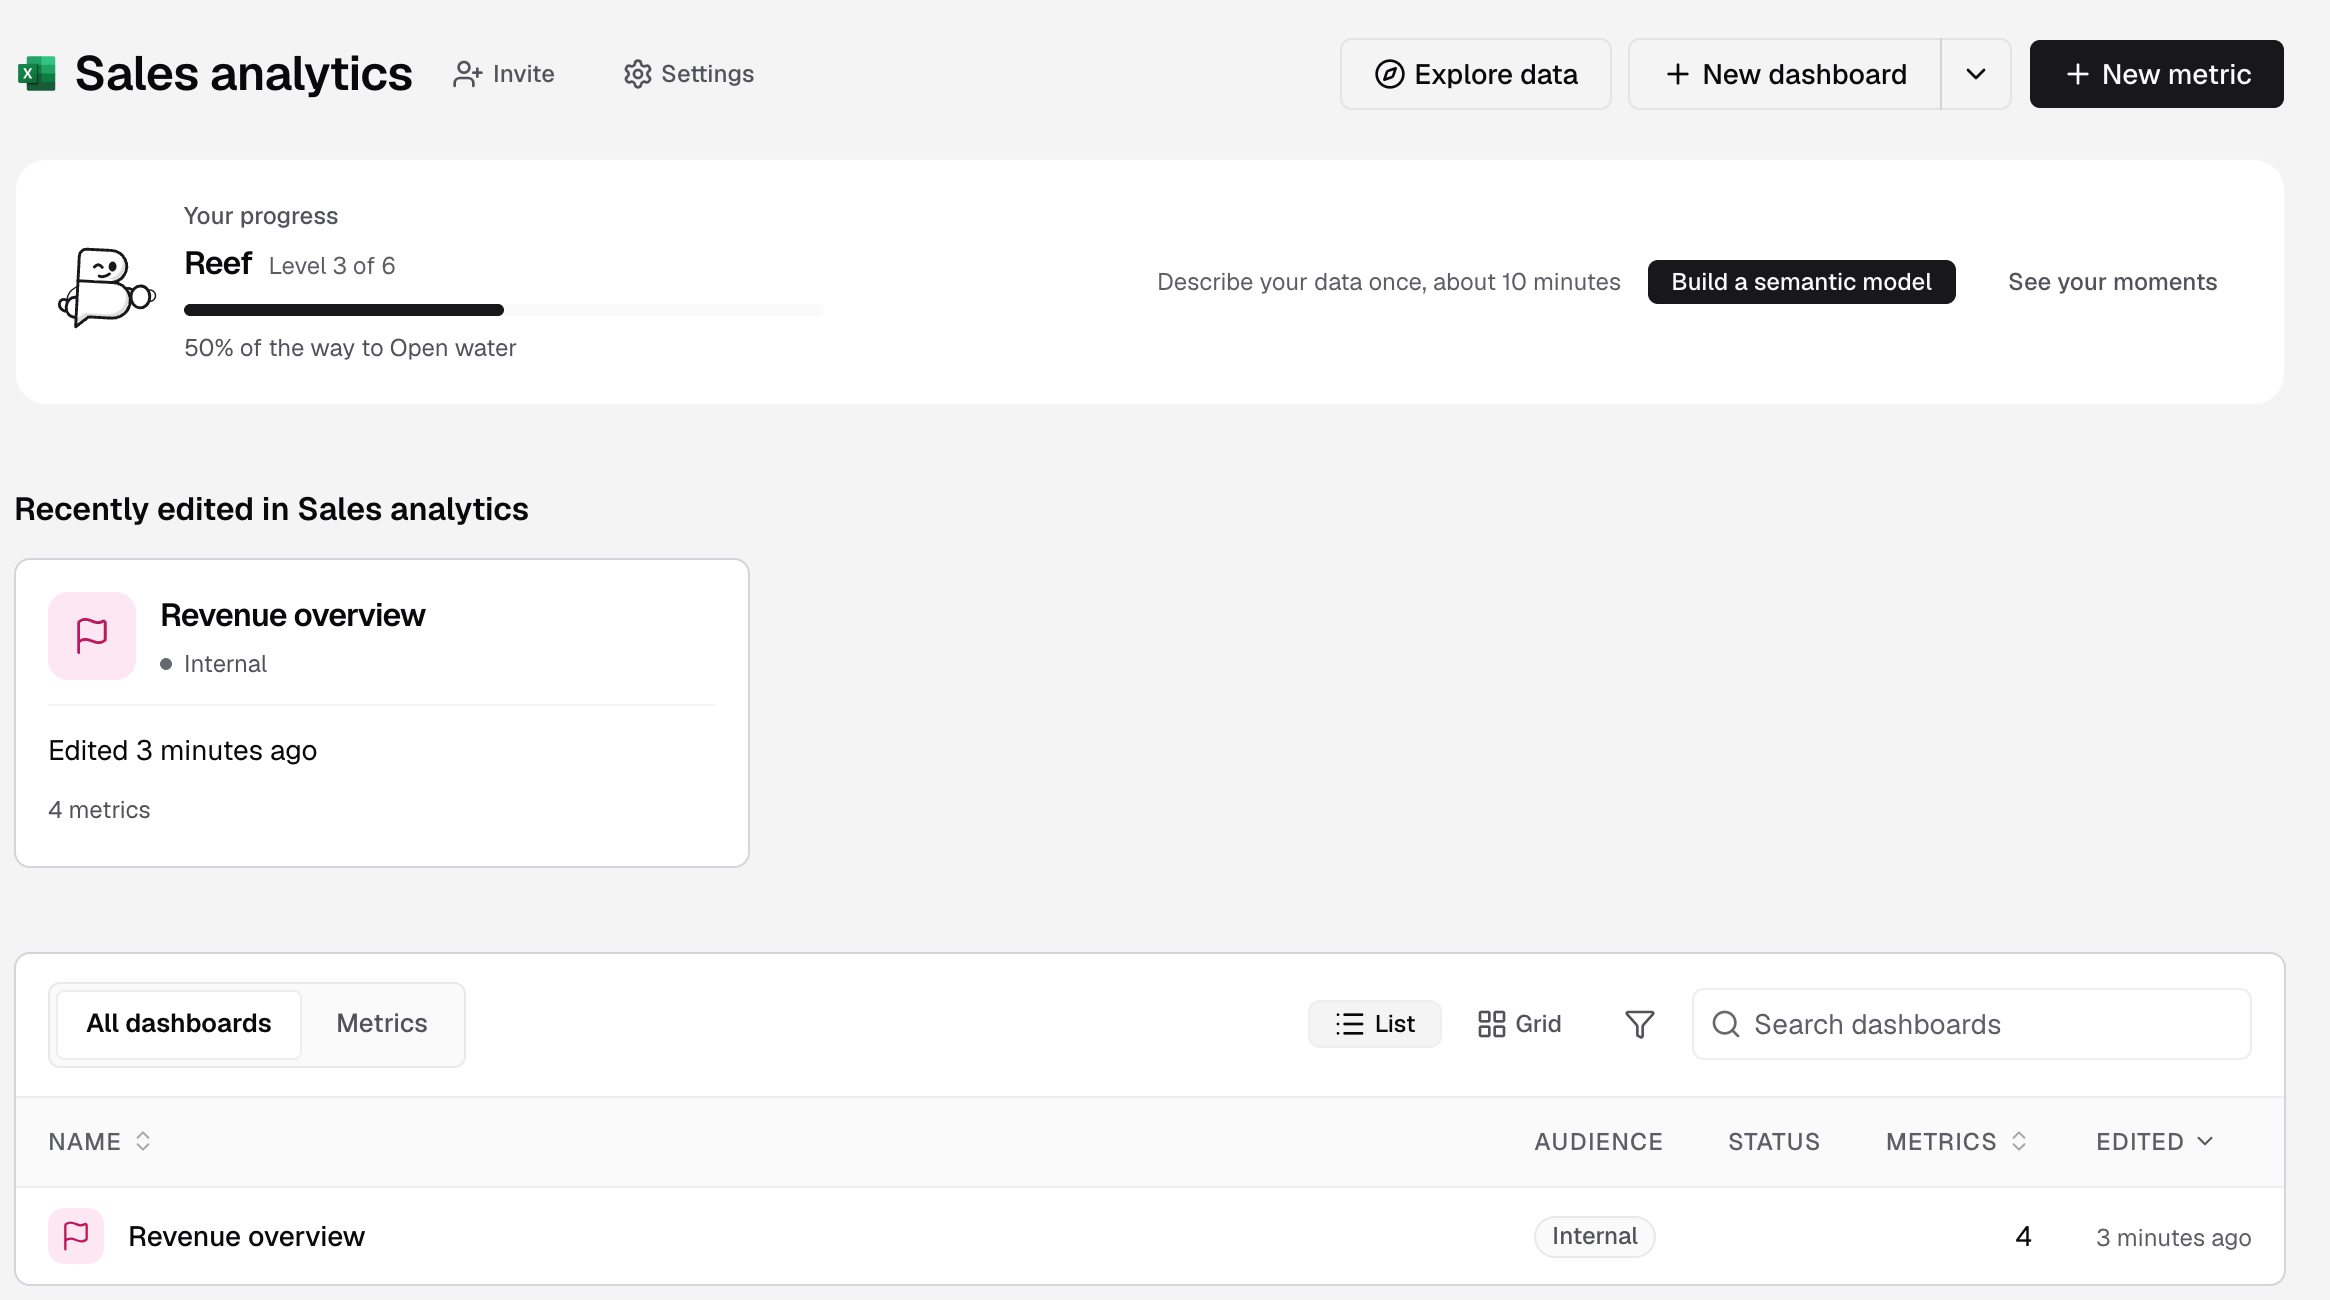
- Your progress shows your level and the next step, for example Connect a datasource. Select See your moments for what you have done so far.
- Recently edited shows the last dashboards changed in the workspace.
- Create workspace is at the top of the sidebar. Use Filter this list to find a workspace, and star one to keep it under Starred.
- What’s new at the bottom of the sidebar shows recent product updates.
Data Studio
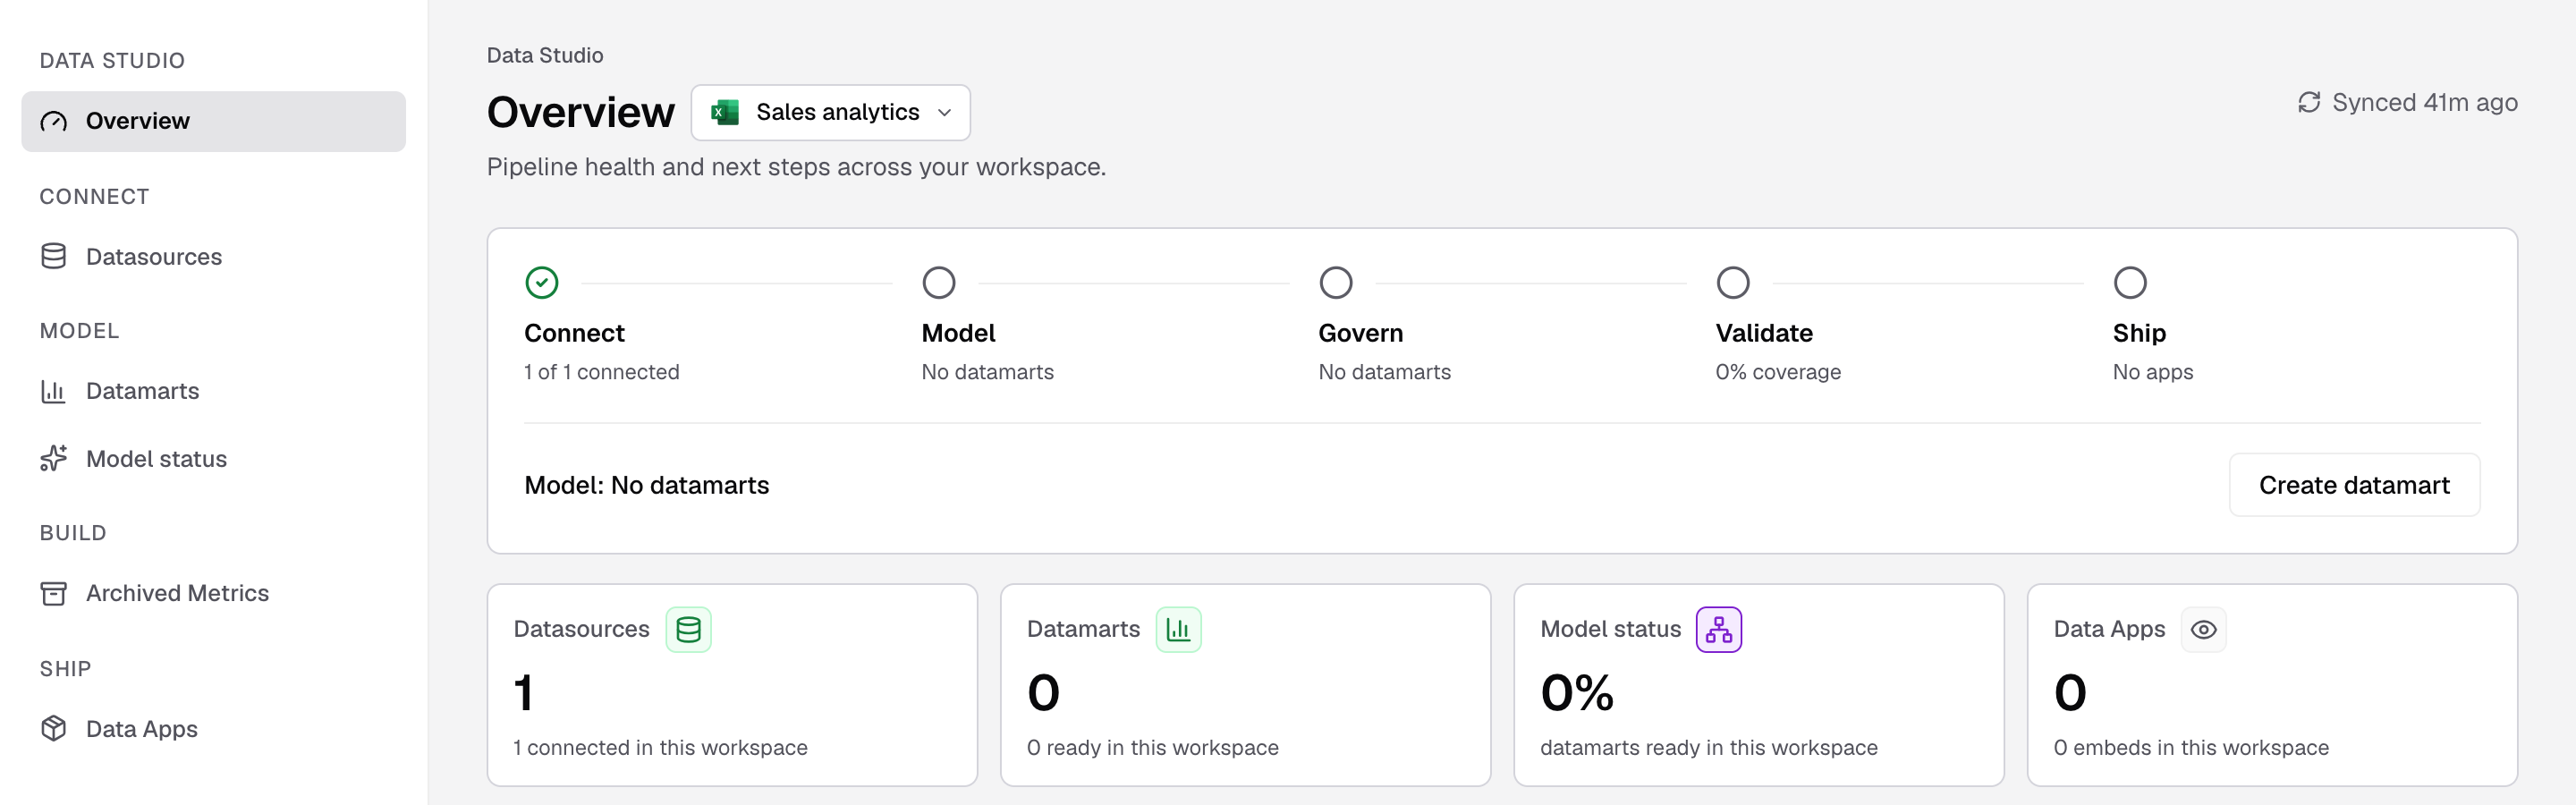
The sidebar groups the pages by stage:
- Connect: Datasources.
- Model: Datamarts and Model status. When semantic models are on for your company, this is Semantic Models.
- Build: Archived Metrics.
- Ship: Data Apps.
You only see the pages your role can open. Guest token usage and Diagnostics are in Settings.
Setup checklist
Admins and builders get a checklist in the sidebar: Set up Databrain for Admins, Start building for builders. Its rows depend on how your company uses Databrain:
- For your customers (embedding): Connect your data, Set your tenant column, Make a dashboard, Create a data app and key, See it in your app, Match your brand.
- For your own team: Connect your data, Ask a question or build a metric, Make a dashboard, Invite your team, Schedule a report.
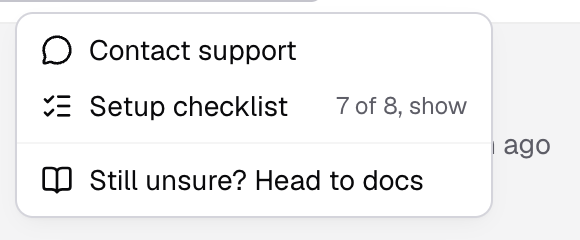
A row ticks itself when the step is really done, for example See it in your app ticks when your first embed loads. If you hid the checklist, open it again from Help (?) > Setup checklist.