

What is Databrain?
The building blocks of Databrain and how they fit together.
Databrain turns the data in your warehouse into metrics and dashboards that your team uses in the app and your customers see inside your product.
Building blocks
| Block | What it is | Where |
|---|---|---|
| Datasource | A connection to a warehouse, a database, an object store, a search engine or an uploaded file. | Data Studio > Datasources |
| Datamart or semantic model | Optional. The tables, joins, tenancy and plain-language descriptions your metrics and Bryn build on. | Data Studio > Datamarts |
| Workspace | A home for dashboards and metrics. It reads from one datasource or datamart, or from several. | Home sidebar |
| Metric | One chart, table or number, built from fields, SQL or a question to Bryn. | Home > Metrics |
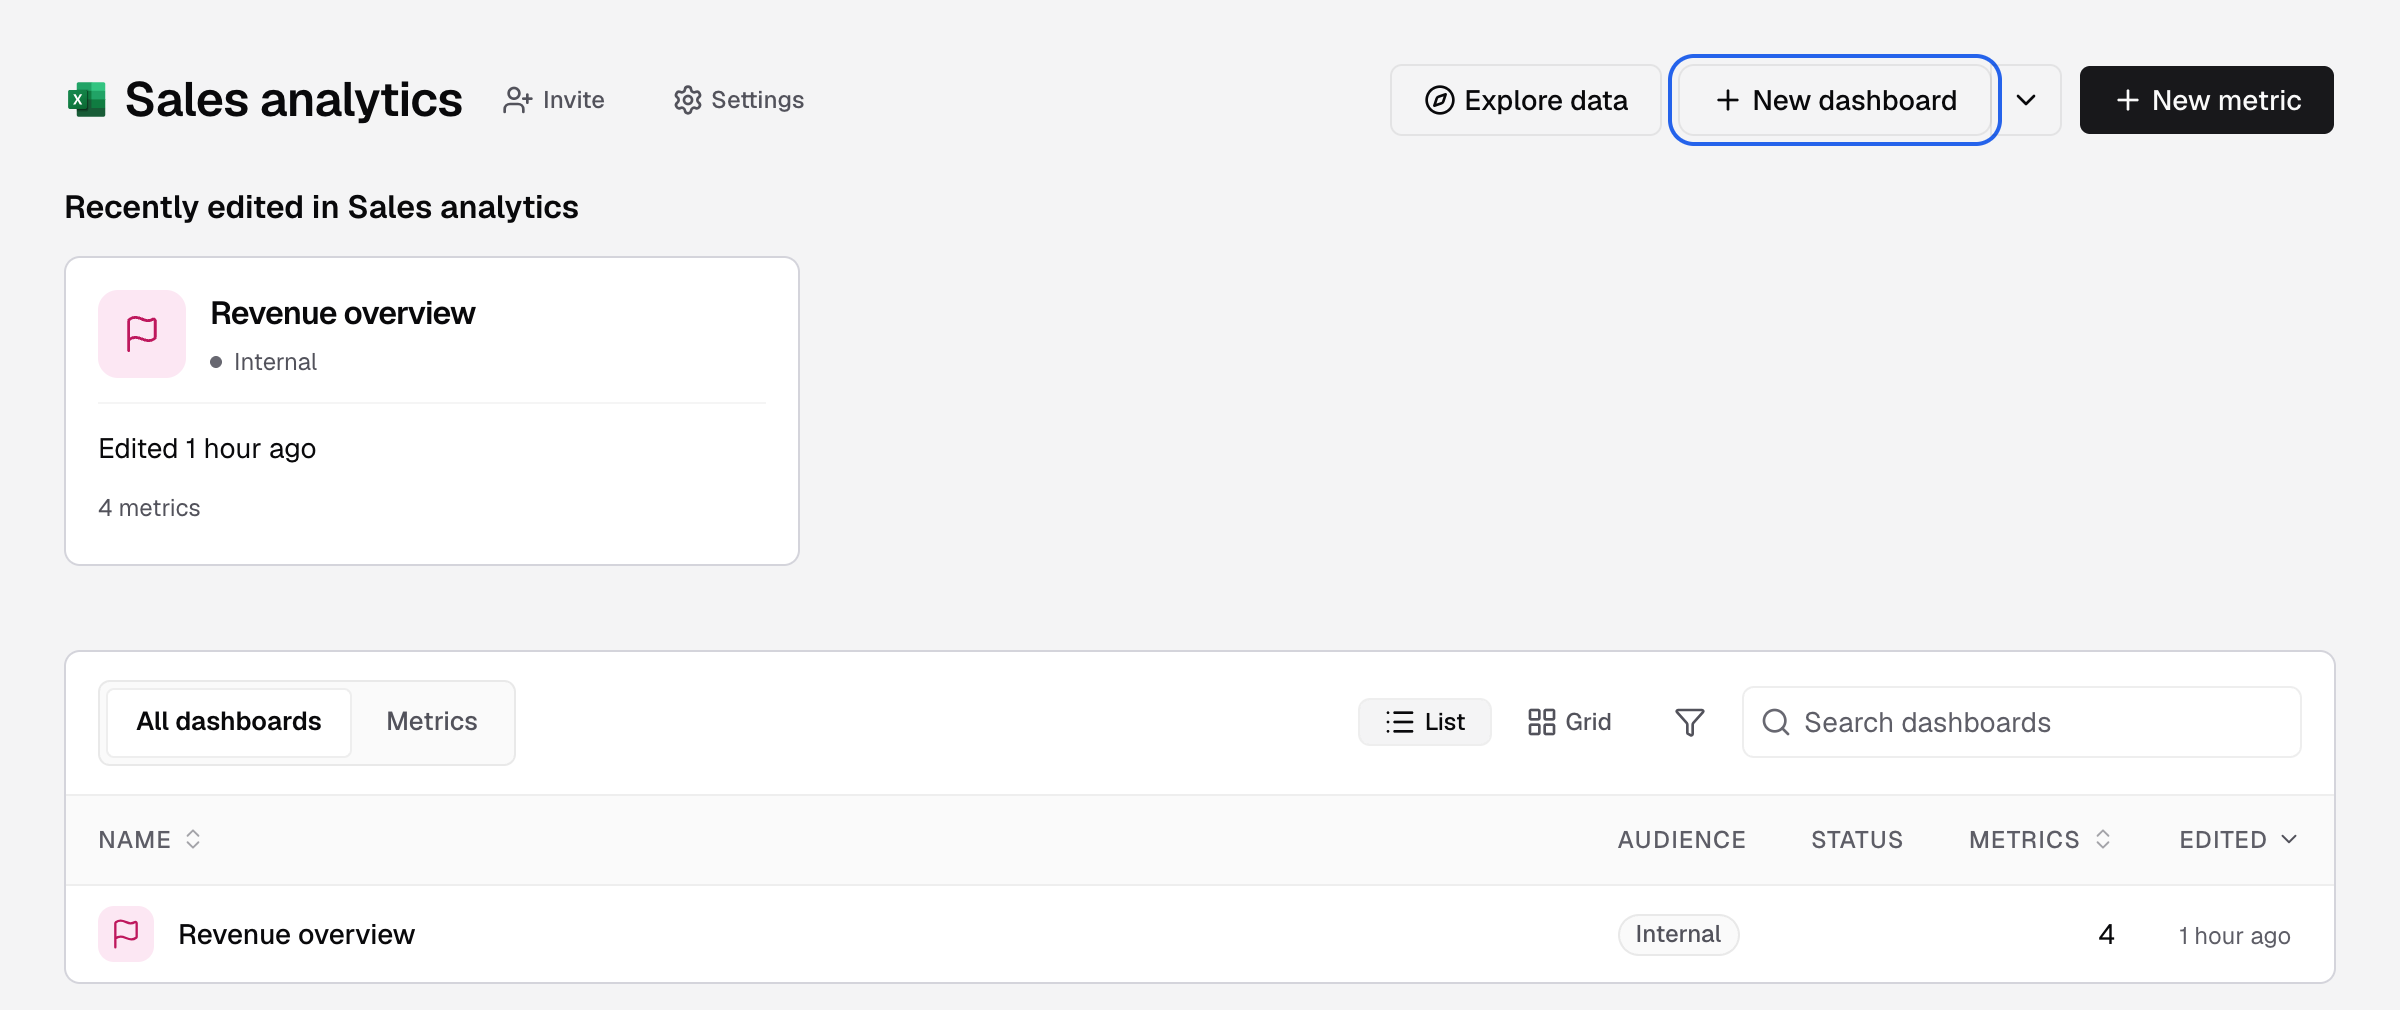
| Dashboard | A page of metrics, text and filters. | Home > All dashboards |
| Data app | The package that delivers dashboards and metrics to your customers: embeds, API keys, allowed domains and theme. | Data Studio > Data Apps |
| Bryn | The AI assistant. It answers questions, builds metrics and helps you model data. | Bryn button in the builder and on dashboards |
How they fit together
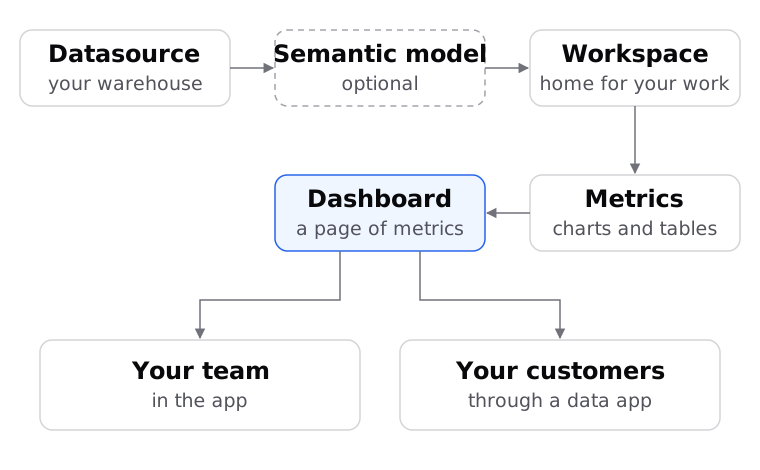
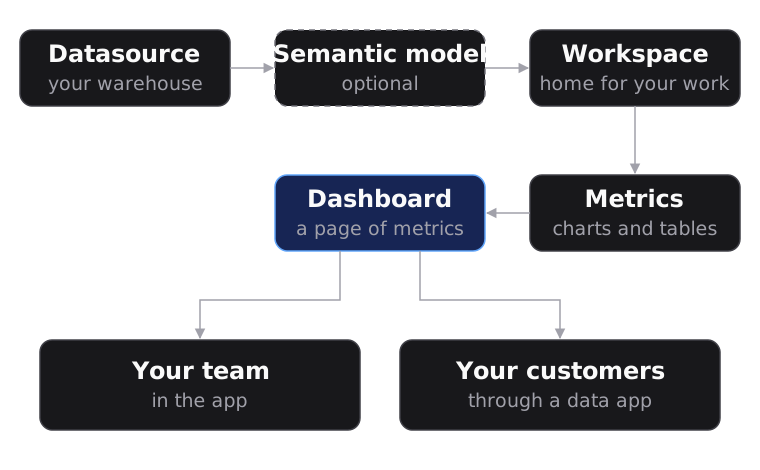
Two ways to use Databrain
- For your own team. Build dashboards in a workspace, invite people with a role, and email reports on a schedule. Start with Connect data and create a dashboard.
- For your customers. Set tenancy so each customer sees only their rows. Add the dashboard to a data app. Your server creates a guest token for each customer, and your frontend shows the dashboard with the
@databrainhq/pluginweb component. Start with Embedding architecture.
A workspace organizes your work. It does not separate one customer’s rows from another’s. Tenancy does that. See Configure tenants.
Next, take the tour of the app.