

Core Concepts
Dashboards
Bring your metrics together in one view, then share or embed it.
What is a dashboard?
A dashboard is one page that brings your metrics together, so you can see how things are going at a glance. It’s where charts, tables and key numbers sit side by side. People use dashboards to keep an eye on KPIs, follow trends and spot things worth a closer look.
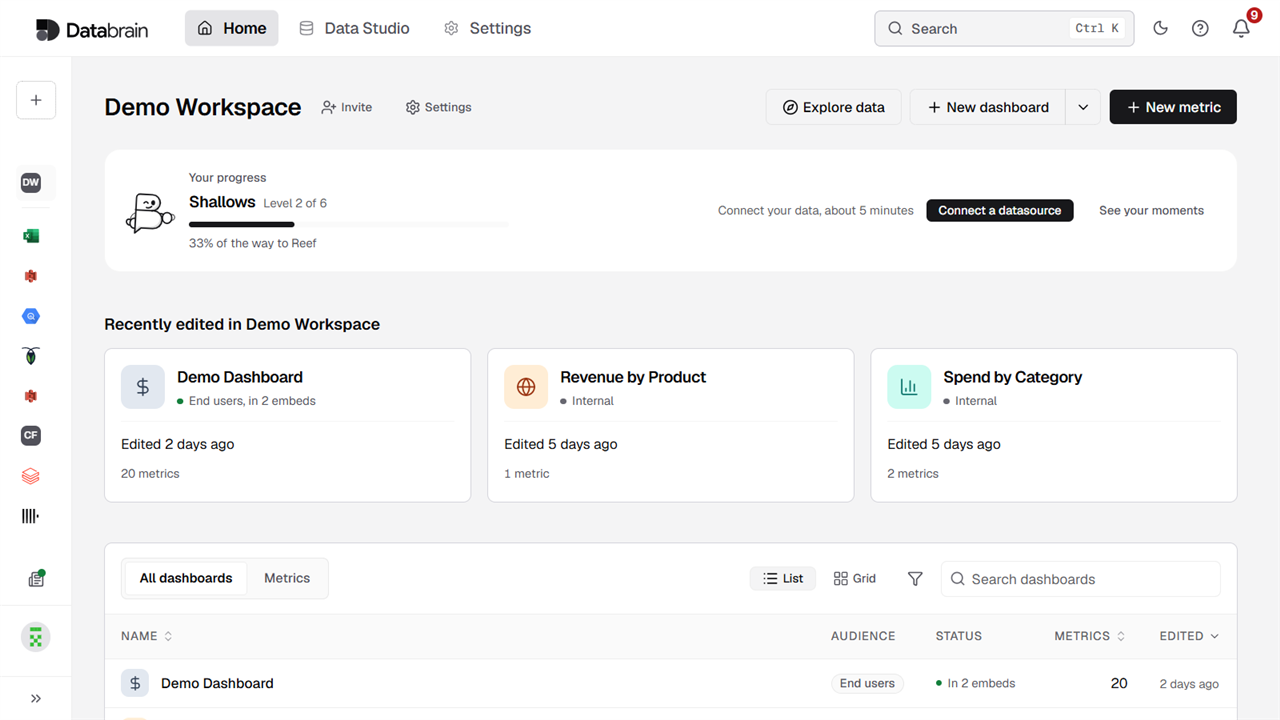
Every dashboard lives inside a workspace. To find yours, select Home, pick the workspace, and look under the All dashboards tab.
What you can do with a dashboard
- Keep things in one place. Put related metrics together, so your team doesn’t have to hunt for them.
- Filter everything at once. Add filters at the top of the dashboard, and they apply to the metrics below.
- Arrange it your way. Move and resize metrics until the layout tells the story you want.
- Stay up to date. Refresh the data when you need it, or switch on auto refresh.
- Share it. Send a preview link to a teammate, or embed the dashboard in your own product.
What’s on a dashboard
A dashboard is built from two kinds of content:
- Metrics: The charts, tables and single numbers that show your data. See Metrics.
- Elements: Text and other content that explains the data, like a title, a short description or a note about the reporting period. See Dashboard elements.
A new dashboard starts empty. Creating it doesn’t add any metrics, so you’ll want to add at least one before you share it.
Create a dashboard
Before you start, you’ll need:
- Access to the workspace where the dashboard will live.
- A name for the dashboard, and an ID for it. The ID is the short, unique label that your app uses to find the dashboard when you embed it.
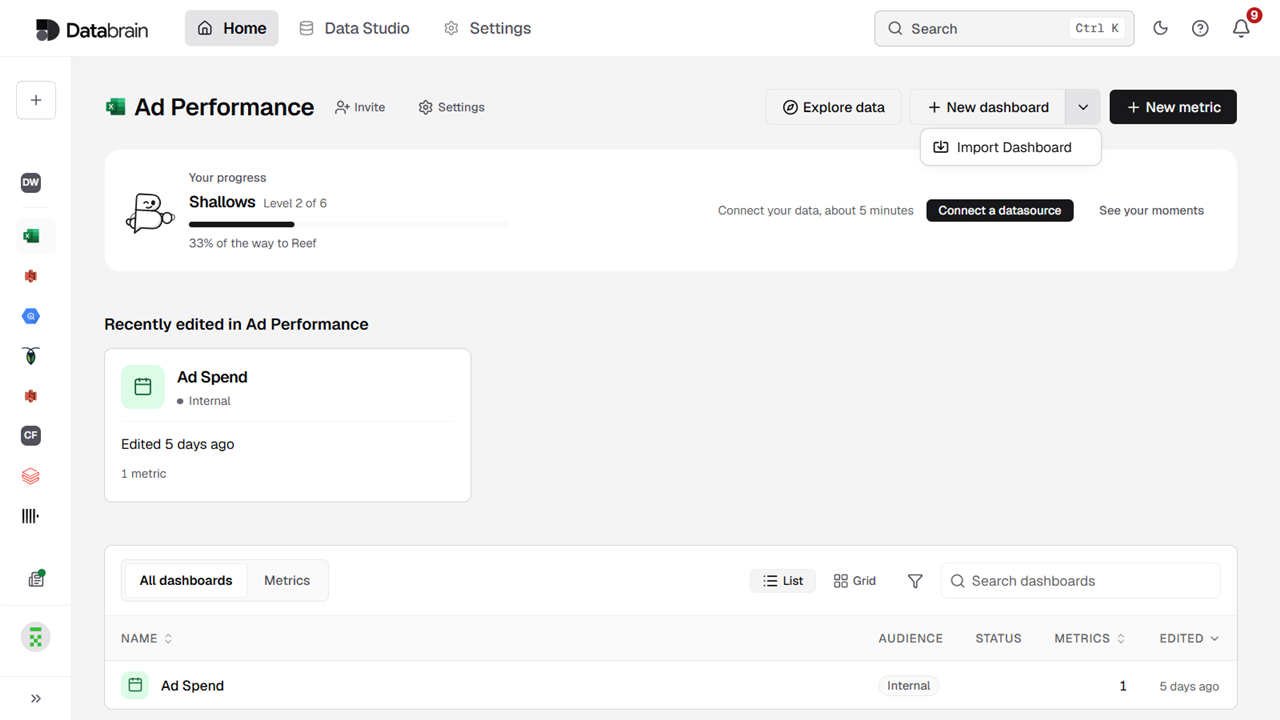
To create one:
- Select Home, then pick your workspace.
- Select New dashboard at the top right.
- Enter a Dashboard Name that people will recognize, like
Revenue overview. - Enter a Dashboard ID, like
revenue-overview. Keep it short, in lowercase, with hyphens instead of spaces. - Select Save.
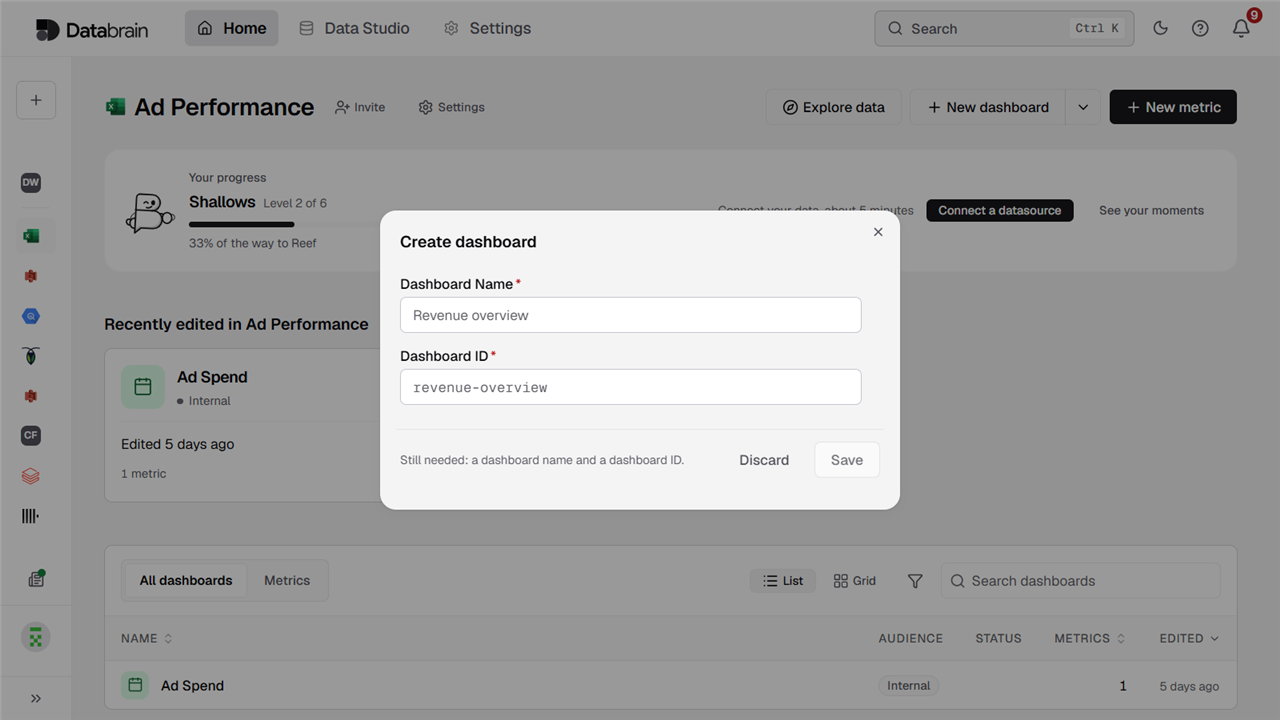
Your new dashboard opens with no metrics yet. Select Add to start building it. If you change your mind, select Discard to close the form without creating anything.
Pick the Dashboard ID with some care. It’s the value your embed code uses in the dashboard-id attribute, so changing it later means updating your code too. This ID is different from the long identifier you’ll see in the dashboard’s web address. For more on both, see Dashboard ID.
If you’d rather watch than read, this short clip shows the same steps. It stops before saving.
Work with a dashboard
Open any dashboard from the All dashboards tab. The bar at the top has what you need to build and share it:
- Add: Put new content on the dashboard.
- Edit layout: Move and resize what’s already there. See Customize layout.
- Export: Take the dashboard out of the app. See Import and export.
- Settings: Change this dashboard’s options. See Dashboard settings.
- Embed and share: Get your embed code, or share a preview link.
- Refresh: Reload the data. The arrow beside it controls auto refresh.
Just below, you’ll see Add filter, where you can add filters for everyone who views the dashboard. See Dashboard filters.
In a workspace that uses a datamart, you’ll also see a datamart selector in this bar. It lets you choose which datamart the dashboard reads from.
Make it easy to read
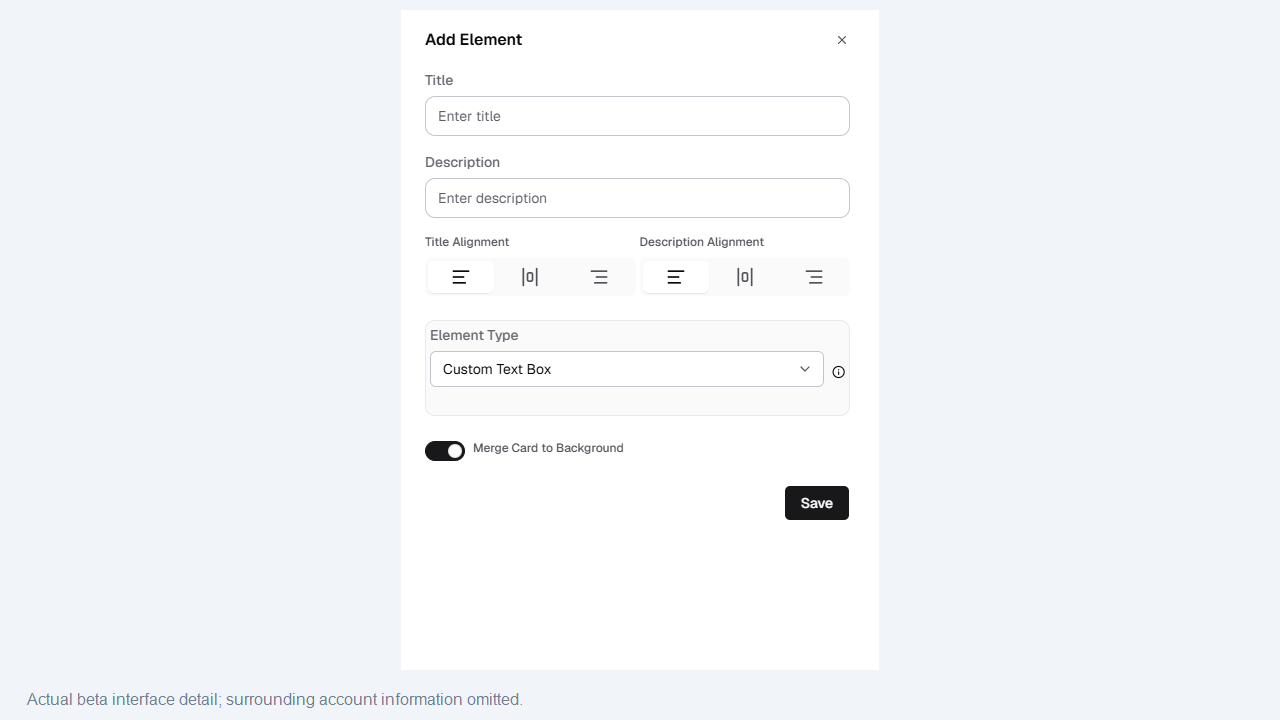
A dashboard is more useful when it explains itself. Use elements to add a title, a short description or a note, such as the period the numbers cover.
Share and embed a dashboard
Select Embed and share on any dashboard to open a panel with everything you need.
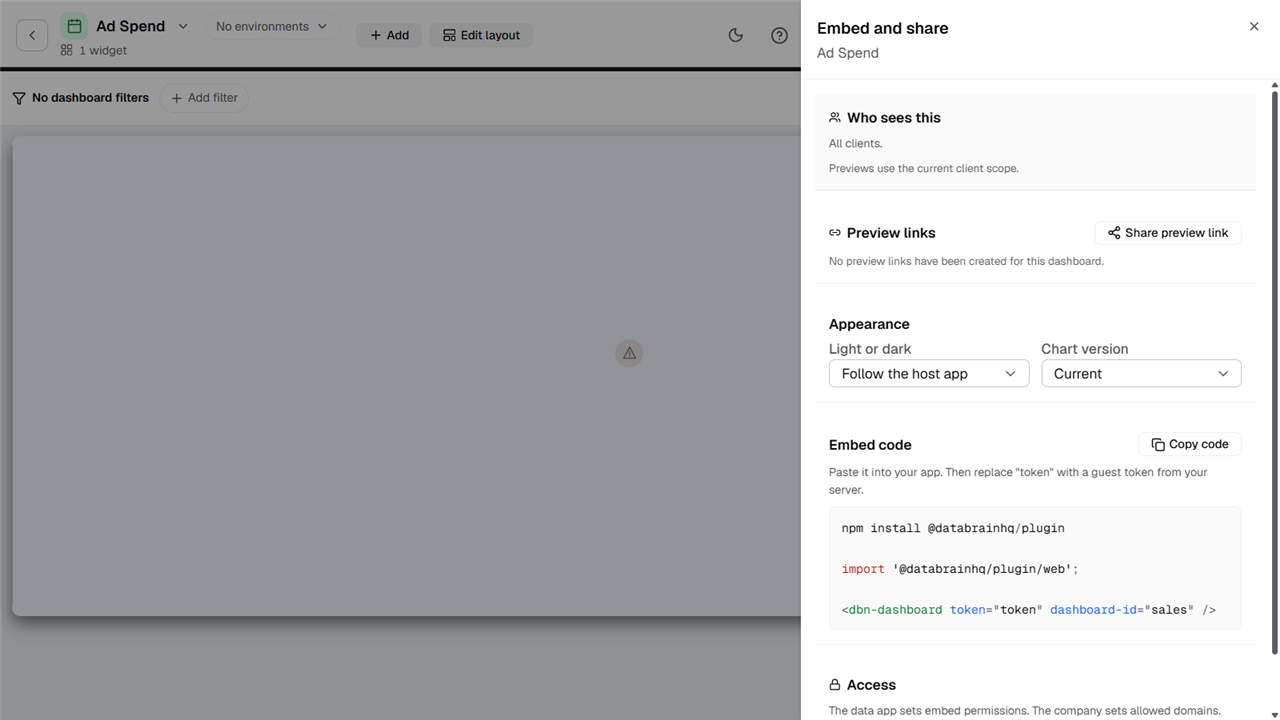
- Who sees this: Shows who the dashboard is for. Previews use the current client scope.
- Preview links: Select Share preview link to give someone a link to look at the dashboard.
- Appearance: Choose Light or dark, or follow your app. You can also pick the Chart version.
- Embed code: Copy the snippet and paste it into your app.
- Access: Go from here to the embed permissions and your allowed domains.
Add the dashboard to your app
-
Install the package:
npm install @databrainhq/plugin -
Import it once, near the top of your app:
import '@databrainhq/plugin/web'; -
Add the dashboard component where you want it to appear:
<dbn-dashboard token="token" dashboard-id="your-dashboard-id" /> -
Replace
tokenwith a guest token. Your server creates one for each of your customers, using the API key of a data app.
Don’t have a data app yet? See Data apps. For the full picture of how the pieces fit together, see Embedding architecture.
Best practices
- Give each dashboard one job. A dashboard that answers one question is easier to read than one that tries to answer ten.
- Put the important things first. Place the numbers people look for at the top, and give them more room.
- Add filters with care. A few well-chosen filters help people explore on their own. Too many get in the way.
- Add a little context. A short title or note saves people from guessing what a chart shows.
- Keep it quick. Fewer metrics per dashboard means faster loading for everyone.
Common ways to use dashboards
- Leadership view: A few headline KPIs and trends, so leaders can see how the business is doing in seconds.
- Day-to-day operations: Up-to-date numbers for the team, with filters to narrow things down.
- Exploring and analysis: Several angles on the same data, for people who want to dig in.
- Customer-facing reporting: A dashboard embedded in your product, showing each customer their own data. To keep one customer’s data separate from another’s, set up tenancy. See Configure tenants.