

Dashboards
Add dashboard elements
Add a text box, an AI summary or a calculated number to a dashboard.
An element is a card that is not a metric. There are three types:
| Element Type | What it shows |
|---|---|
| Custom Text Box | Formatted text, links and images. For example, a title or a note about the reporting period. |
| Metric Summary | An AI-written summary of the metrics you pick. See Metric summary. |
| Metric Expression | One number calculated from single-value metrics, for example {{metricId_1}}/{{metricId_2}}. See Metric expression. |
Before you start
- You are an Admin, or your role has the elements Create permission. The default Editor role does not have it.
- For Metric Summary: turn on Summarise metric data in the workspace settings, under Intelligence > Metric summary.
- For Metric Expression: the dashboard has at least one Single value metric.
Steps
-
Open the dashboard and select Add element in the header.

Add element is the image icon in the dashboard header. -
Enter a Title and an optional Description.
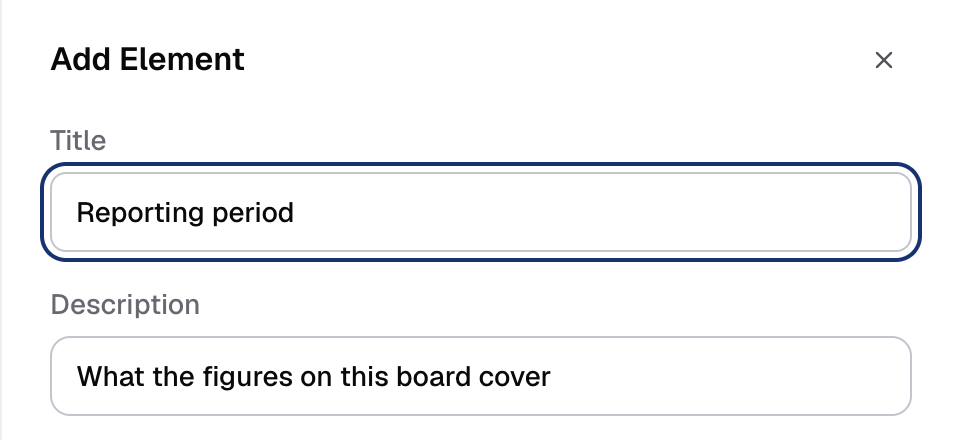
The Add Element panel opens on the right with Title and Description. -
Optional: set Title Alignment and Description Alignment.
-
In Element Type, choose Custom Text Box, Metric Summary or Metric Expression.
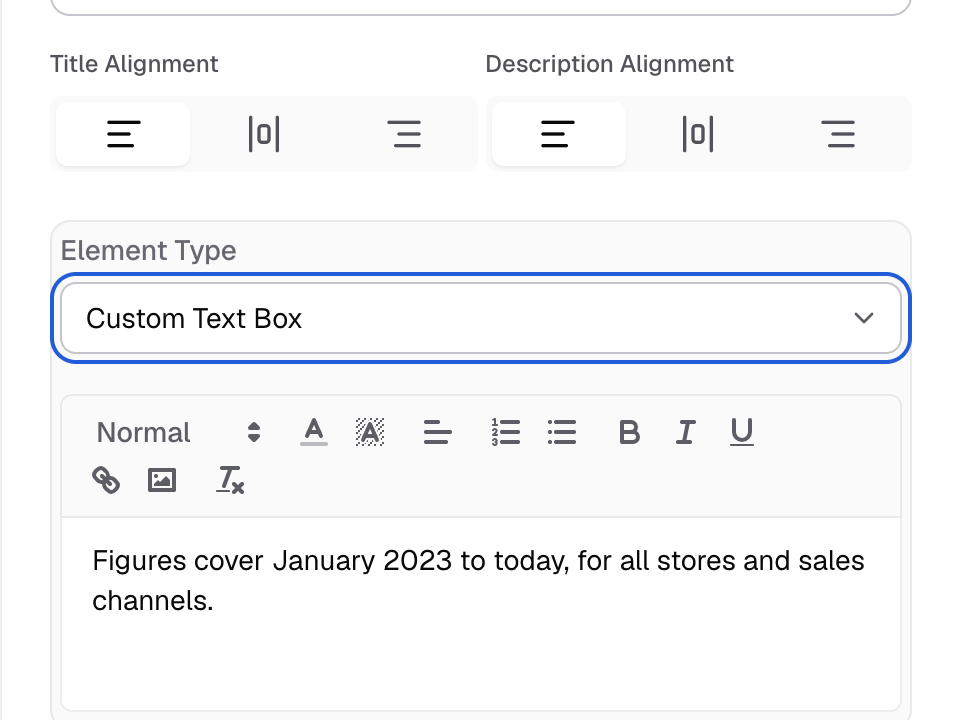
Element Type sets what the card shows; a text box adds an editor below it. -
Fill in the content for that type. For a text box, type in the editor and use the toolbar to format.
-
Optional: turn on Merge Card to Background to remove the card border and background.
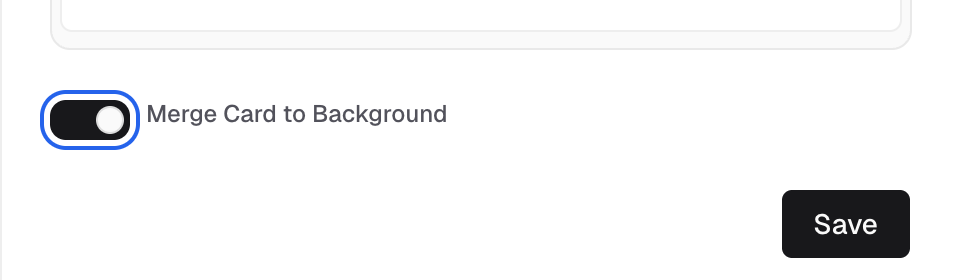
Merge Card to Background removes the card border and background. -
Select Save.
The element appears on the dashboard. To put it in a set place, hover between cards and select +, then Add element. To move it later, use Edit layout.
To change or delete an element, select its card. Delete asks you to confirm in Delete Element?.
If something goes wrong
- Metric Summary is disabled in Workspace Settings. Turn on Summarise metric data in the workspace settings.
- No Single Card metrics found. Create a metric with the Single value chart first.
- Metric Expression is not available. The datasource is OpenSearch or Elasticsearch.