

Core Concepts
Metrics
Turn your data into charts, tables and key numbers, then put them on dashboards.
What is a metric?
A metric is a single view of your data. It could be a chart, a table or one big number, like total revenue this month. You build each metric from a query, and then you place it on a dashboard.
Metrics are the building blocks of dashboards. Build them once, and you can put them where people need to see them.
What you can do with a metric
- Show your data the way you like. Pick from around twenty chart types, from bar and line charts to tables, gauges and single values.
- Build it your way. Pick fields with clicks, write your own SQL, or describe what you want and let Bryn, the built-in AI assistant, build it for you.
- Check it before you save. See your chart, table and query as you work, and preview it as a client sees it.
- Narrow it down. Add filters, sorting and grouping so a metric shows exactly what matters.
- Use it anywhere. Put it on a dashboard, or embed it on its own in your product.
Find your metrics
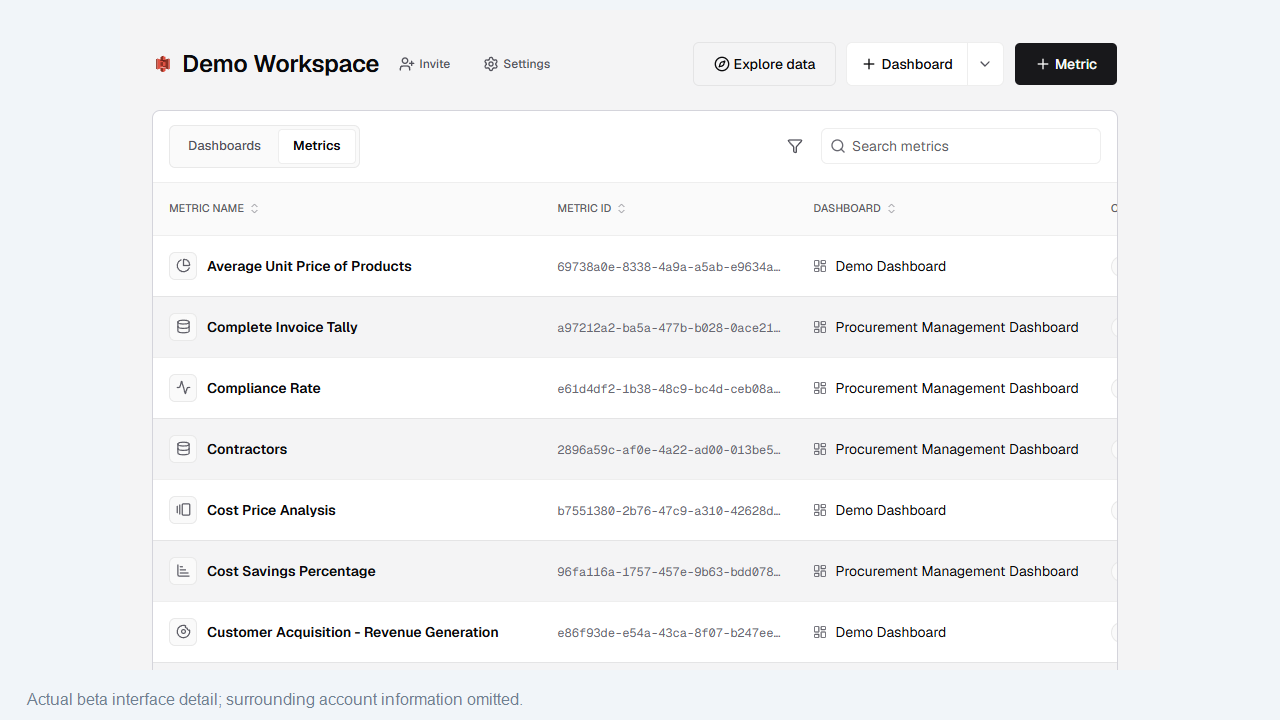
Every workspace keeps a list of its metrics, so you can find one without opening each dashboard.
- Select Home, then pick your workspace.
- Open the Metrics tab.
- Use Search metrics to find one by name.
The list shows each metric’s name, its Metric ID, and the dashboard it belongs to. The ID is the short label your app uses when it embeds a metric.
Create a metric
Before you start, you’ll need:
- A workspace with a connected datasource or datamart. See Workspaces.
- A dashboard to save the metric to. You can create one from the save step if you don’t have one yet.
To open the metric builder:
- Select Home, then pick your workspace.
- Select New metric at the top right.
You can also open it from a dashboard. Select Add on the dashboard, or Create metric if the dashboard is empty.
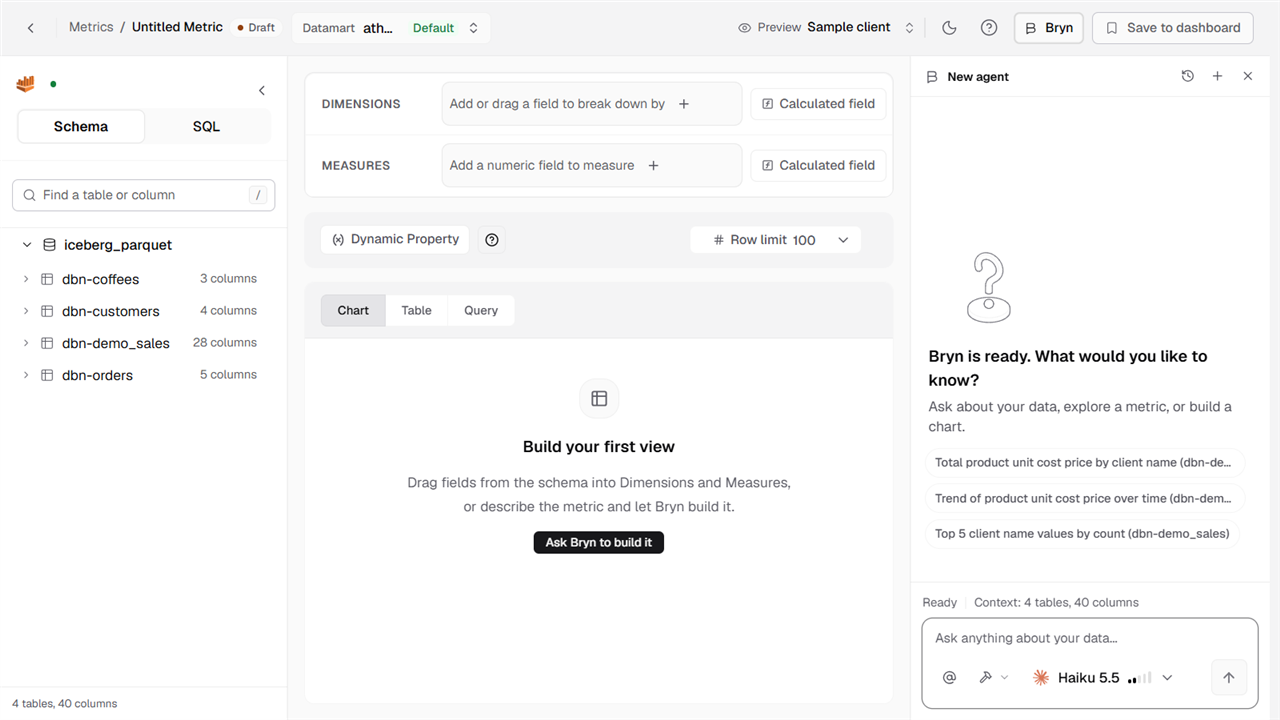
A new metric starts as Untitled Metric with a Draft label. You can build it in three ways.
Build it with fields
This is the easiest way to start, and you don’t need to write any SQL.
- In the Schema list, find the table you want. Use Find a table or column to search.
- Double-click a text field to add it to Dimensions. This is what you’re breaking the data down by, like a product or a month.
- Double-click a number field to add it to Measures. This is what you’re counting or adding up, like a price or a total.
- Choose how to combine the numbers. The measure shows SUM by default, and you can change it.
You can also drag fields in. As soon as you add fields, the builder runs the query and shows a preview.
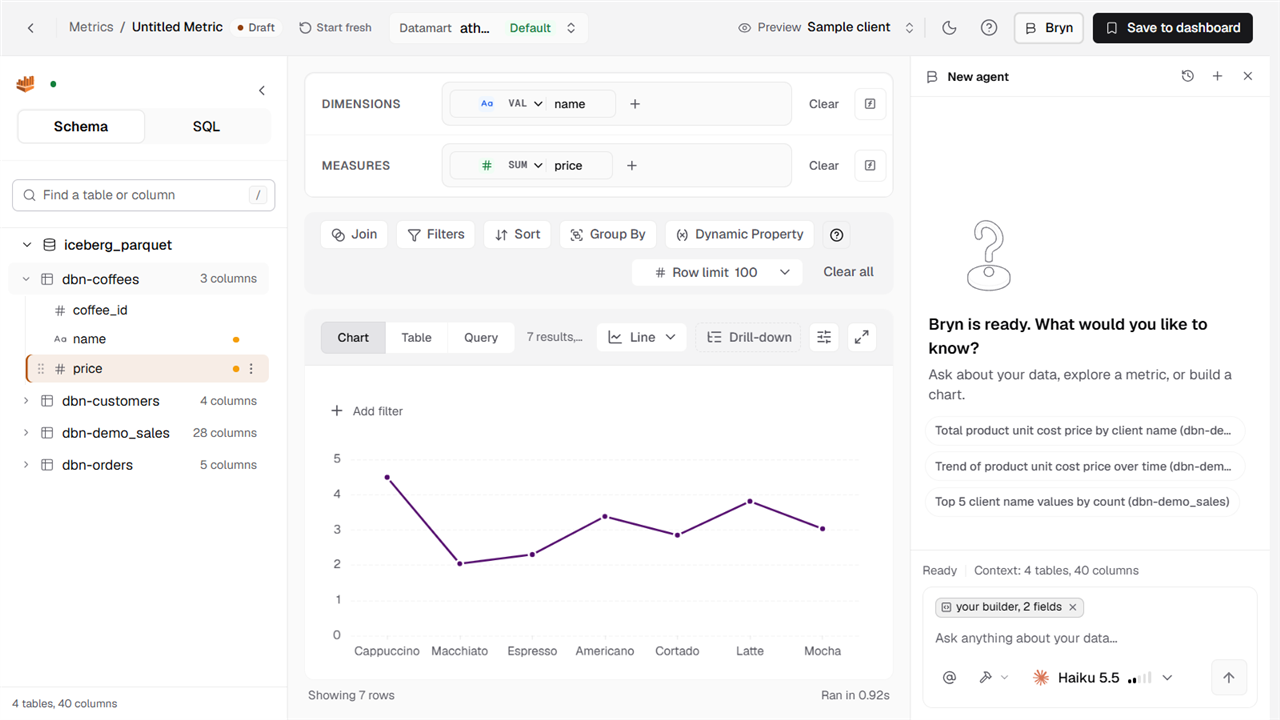
Under the fields you’ll find these controls:
- Join: Combine more than one table. See Joins, filters, sort and group by.
- Filters: Keep only the rows you want.
- Sort: Put the results in the order you need.
- Group By: Choose how the results are grouped.
- Dynamic Property: Change how a metric looks based on its values. See Dynamic property.
- Row limit: Cap how many rows come back. It’s 100 by default.
Need a field that isn’t in your data? Select Calculated field to build one from a formula, with no SQL. See Create custom columns.
Write your own SQL
If you’re comfortable with SQL, you have full control over the query.
- Select SQL above the schema list.
- Write your query in the editor. Select Format query to tidy it up.
- Select Run query to see the results under Query result.
- Select Chart builder to turn the results into a chart, or Exit SQL mode to go back to building with fields.
For the full steps, see Create a metric using custom SQL.
Ask Bryn
Not sure where to start? Describe what you want in plain words, like “total revenue by region for the last quarter”. Select Ask Bryn to build it, or type in the Bryn panel. Bryn writes the query and builds the metric for you, and you can keep adjusting it yourself afterwards.
For more, see Create a metric using chat mode.
Choose a chart type
Once you have results, use the Chart type menu to pick how to show them. The builder looks at your data and recommends what fits best, then lists the other options below.
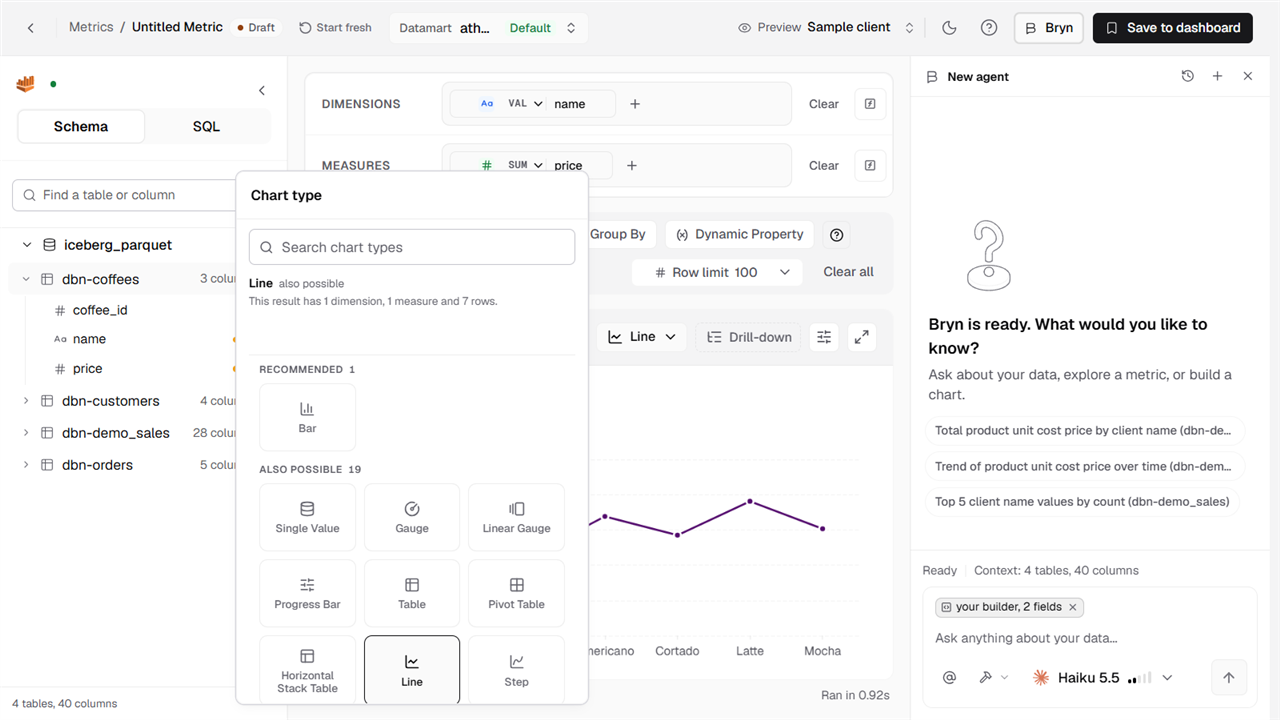
Here are some of the types you can choose from:
- Bar and line charts: Compare values across categories, or follow a trend over time.
- Single Value: One key number, like total sales.
- Gauge, Linear Gauge and Progress Bar: How close you are to a goal.
- Table and Pivot Table: Rows of data you can read closely, or look at from several angles.
Not sure which to pick? Start with the recommended one. The menu also tells you why a type does or doesn’t suit your results, so you can try a few and see.
You can change how a chart looks too, like colors, labels and legends. See Chart appearance.
Add filters
Filters decide which rows a metric shows. You can add them while you build.
- Fixed filters: Always apply the same condition, such as only one country or a date range.
- Variable filters: Let people change the filter on a dashboard. See Variable filters.
- Custom SQL filters: Write your own condition for advanced cases. See Custom SQL filters.
Save a metric to a dashboard
When you’re happy with the result, save it.
- Select Save to dashboard at the top right. It turns on once your metric has a measure.
- Under Dashboard, choose where it should go, or select New dashboard to create one.
- Enter a Metric title. This is the name people will see.
- Enter a Metric ID. This is the label your app uses to find the metric.
- Add a Metric description if you’d like. It helps people understand what they’re looking at.
- Select Save.
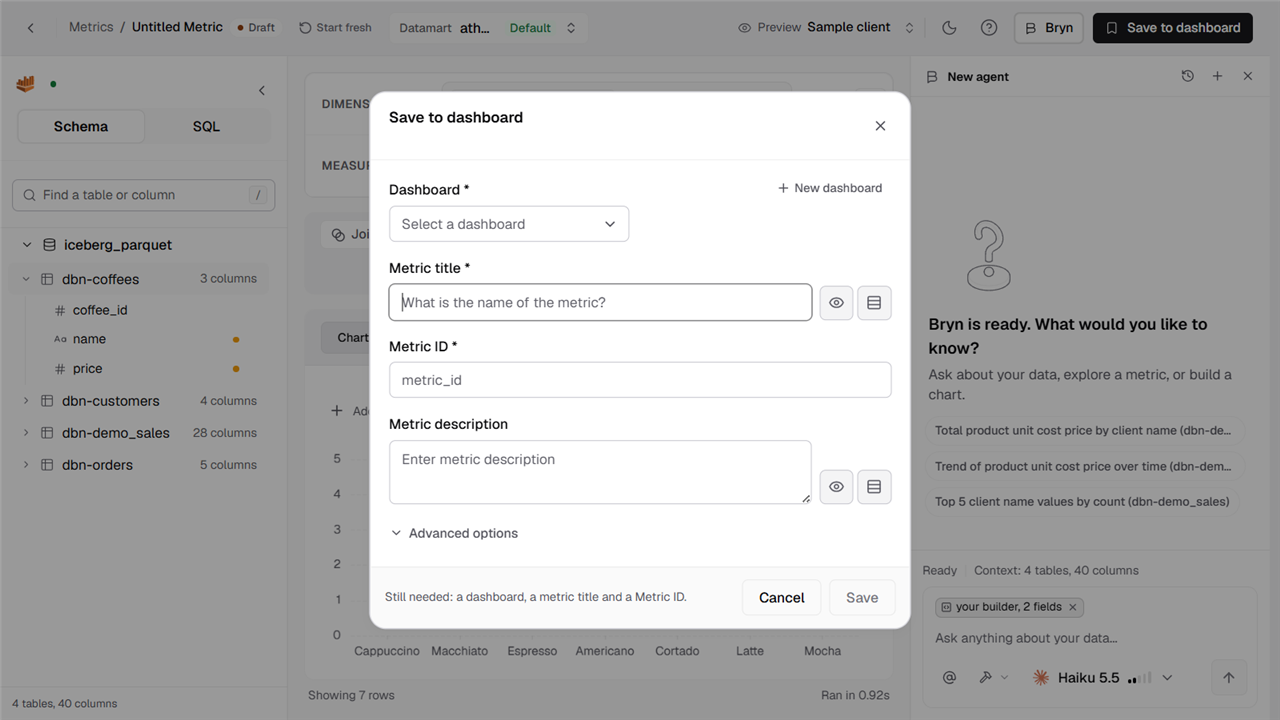
Choose the Metric ID with some care. If you embed the metric, your code uses this ID, so changing it later means updating your code too. For more, see Metric ID.
Get more from your metrics
- Add drill-down. Let people click a value to see the detail behind it. See Chart actions.
- Explain it in plain language. Turn on an AI summary for a metric. See AI summary.
- Build a calculation from other metrics. Use an expression on a single-value card. See Metric expressions.
- Keep things tidy. Edit a metric, archive one you no longer use, or find drafts that you haven’t published. See Edit a metric.
- Take the data with you. Download a metric or its underlying data. See Download a metric.
- Browse by datasource. See Metric Store.
Embed a metric
You can put a single metric in your own app, without the rest of the dashboard.
<dbn-metric token="token" metric-id="your-metric-id" />Replace token with a guest token that your server creates for each customer, and metric-id with the Metric ID you saved. For the setup, see Dashboards and Embedding architecture.
Best practices
- Pick the right chart. Bars for comparing, lines for trends, and a single value for the one number that matters.
- Keep it simple. A chart that’s easy to read beats one with every detail.
- Use clear titles. Say what the metric shows, like “Revenue by product”, so people don’t have to guess.
- Add a little context. A short description helps people understand what they’re looking at.
- Keep it fast. Use filters and a sensible row limit, and summarize your data in the query where you can.