

Chart appearance
Change how a chart looks
Set number formats, labels, axes, legend and colors for one chart.
Change how a chart looks in Chart settings. The data does not change.
Before you start
- You have a metric open in the metric builder, with a chart showing. Pick a chart type
Steps
-
In the chart toolbar, select Appearance. Chart settings opens on the Appearance tab.
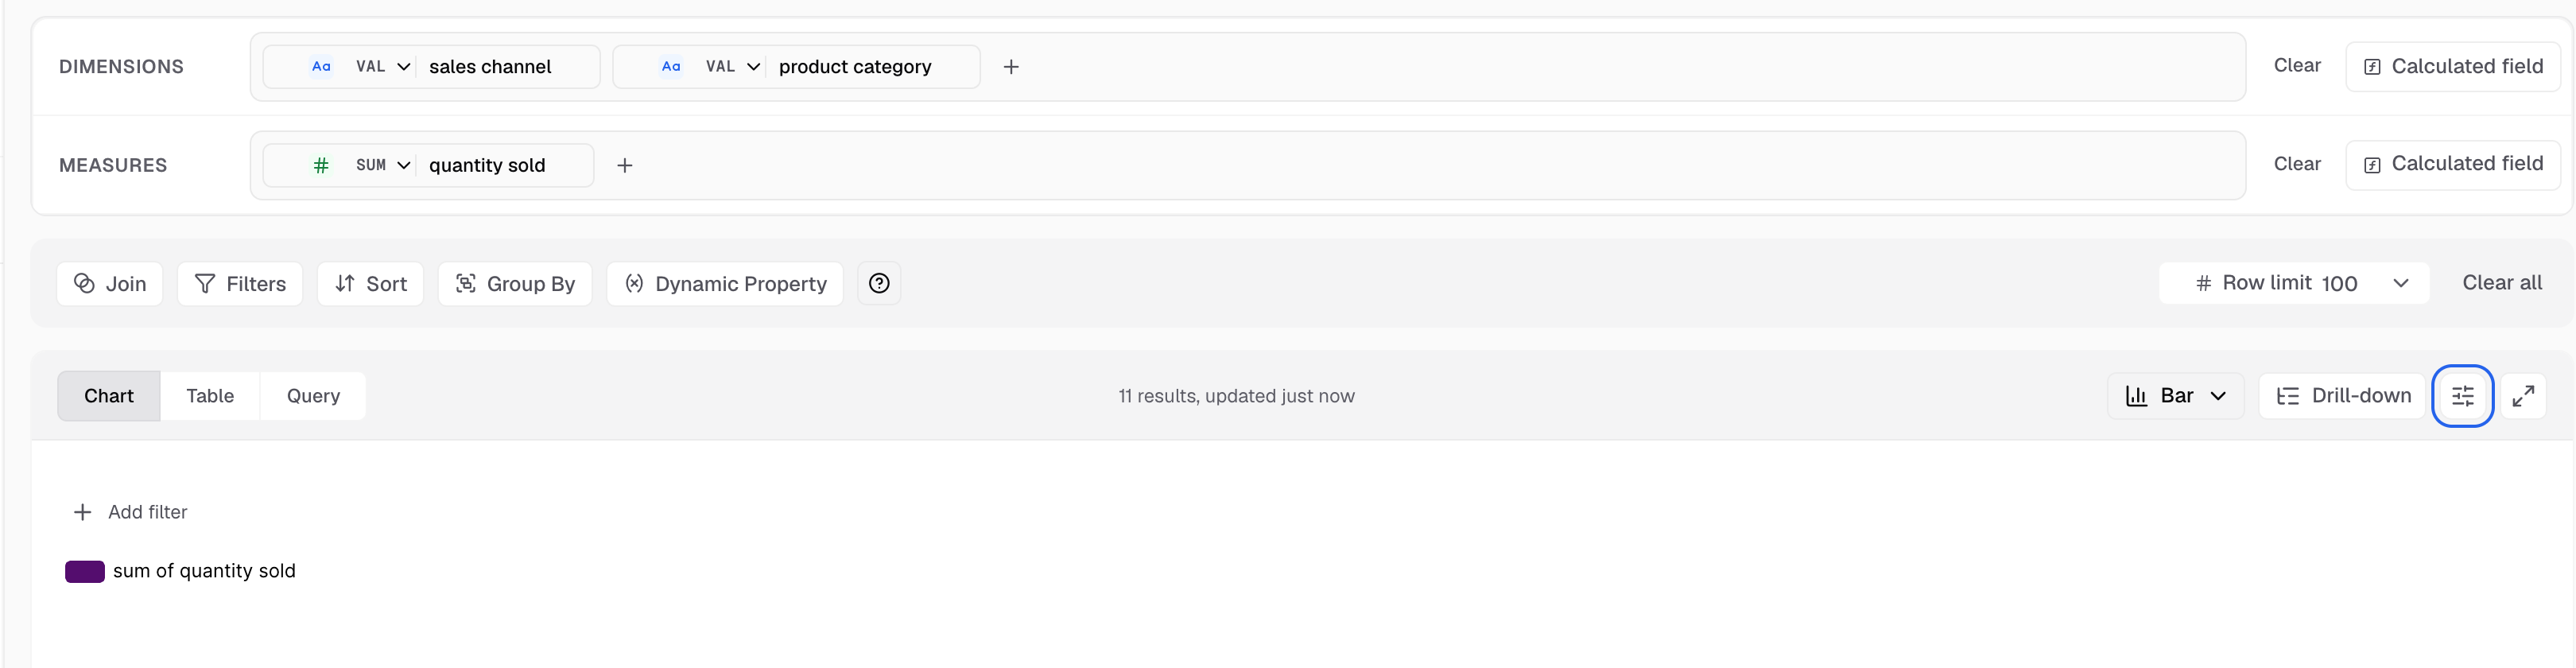
Appearance is the sliders icon next to Drill-down. -
Change a setting. The Live preview on the right shows the result.
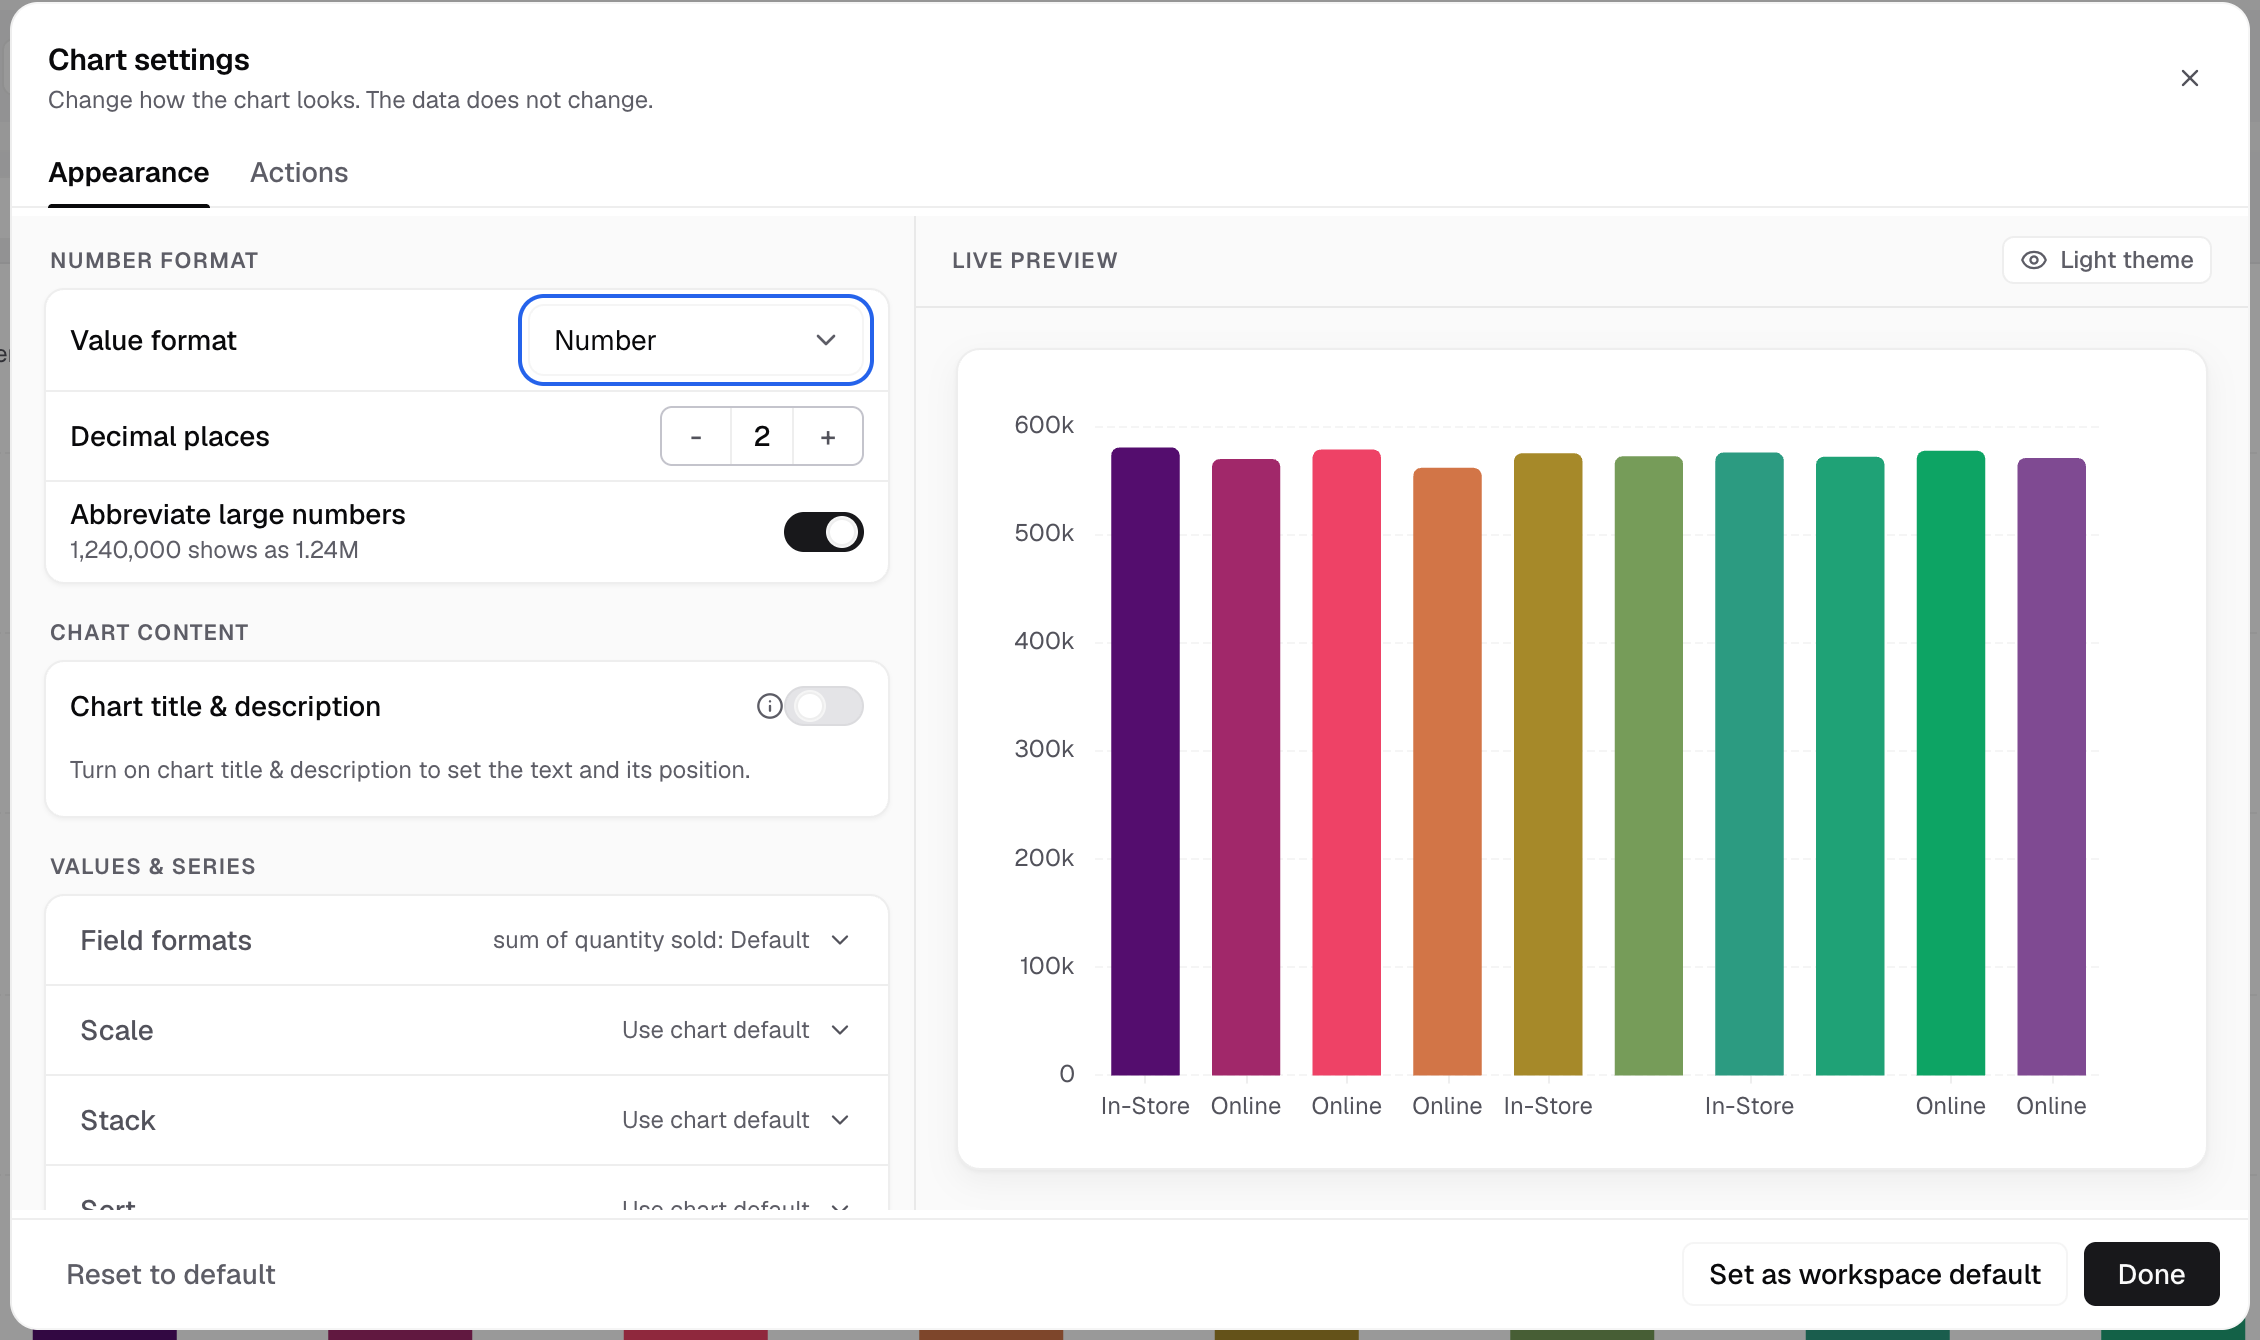
Change a setting on the left. The Live preview on the right updates. -
Select Done.
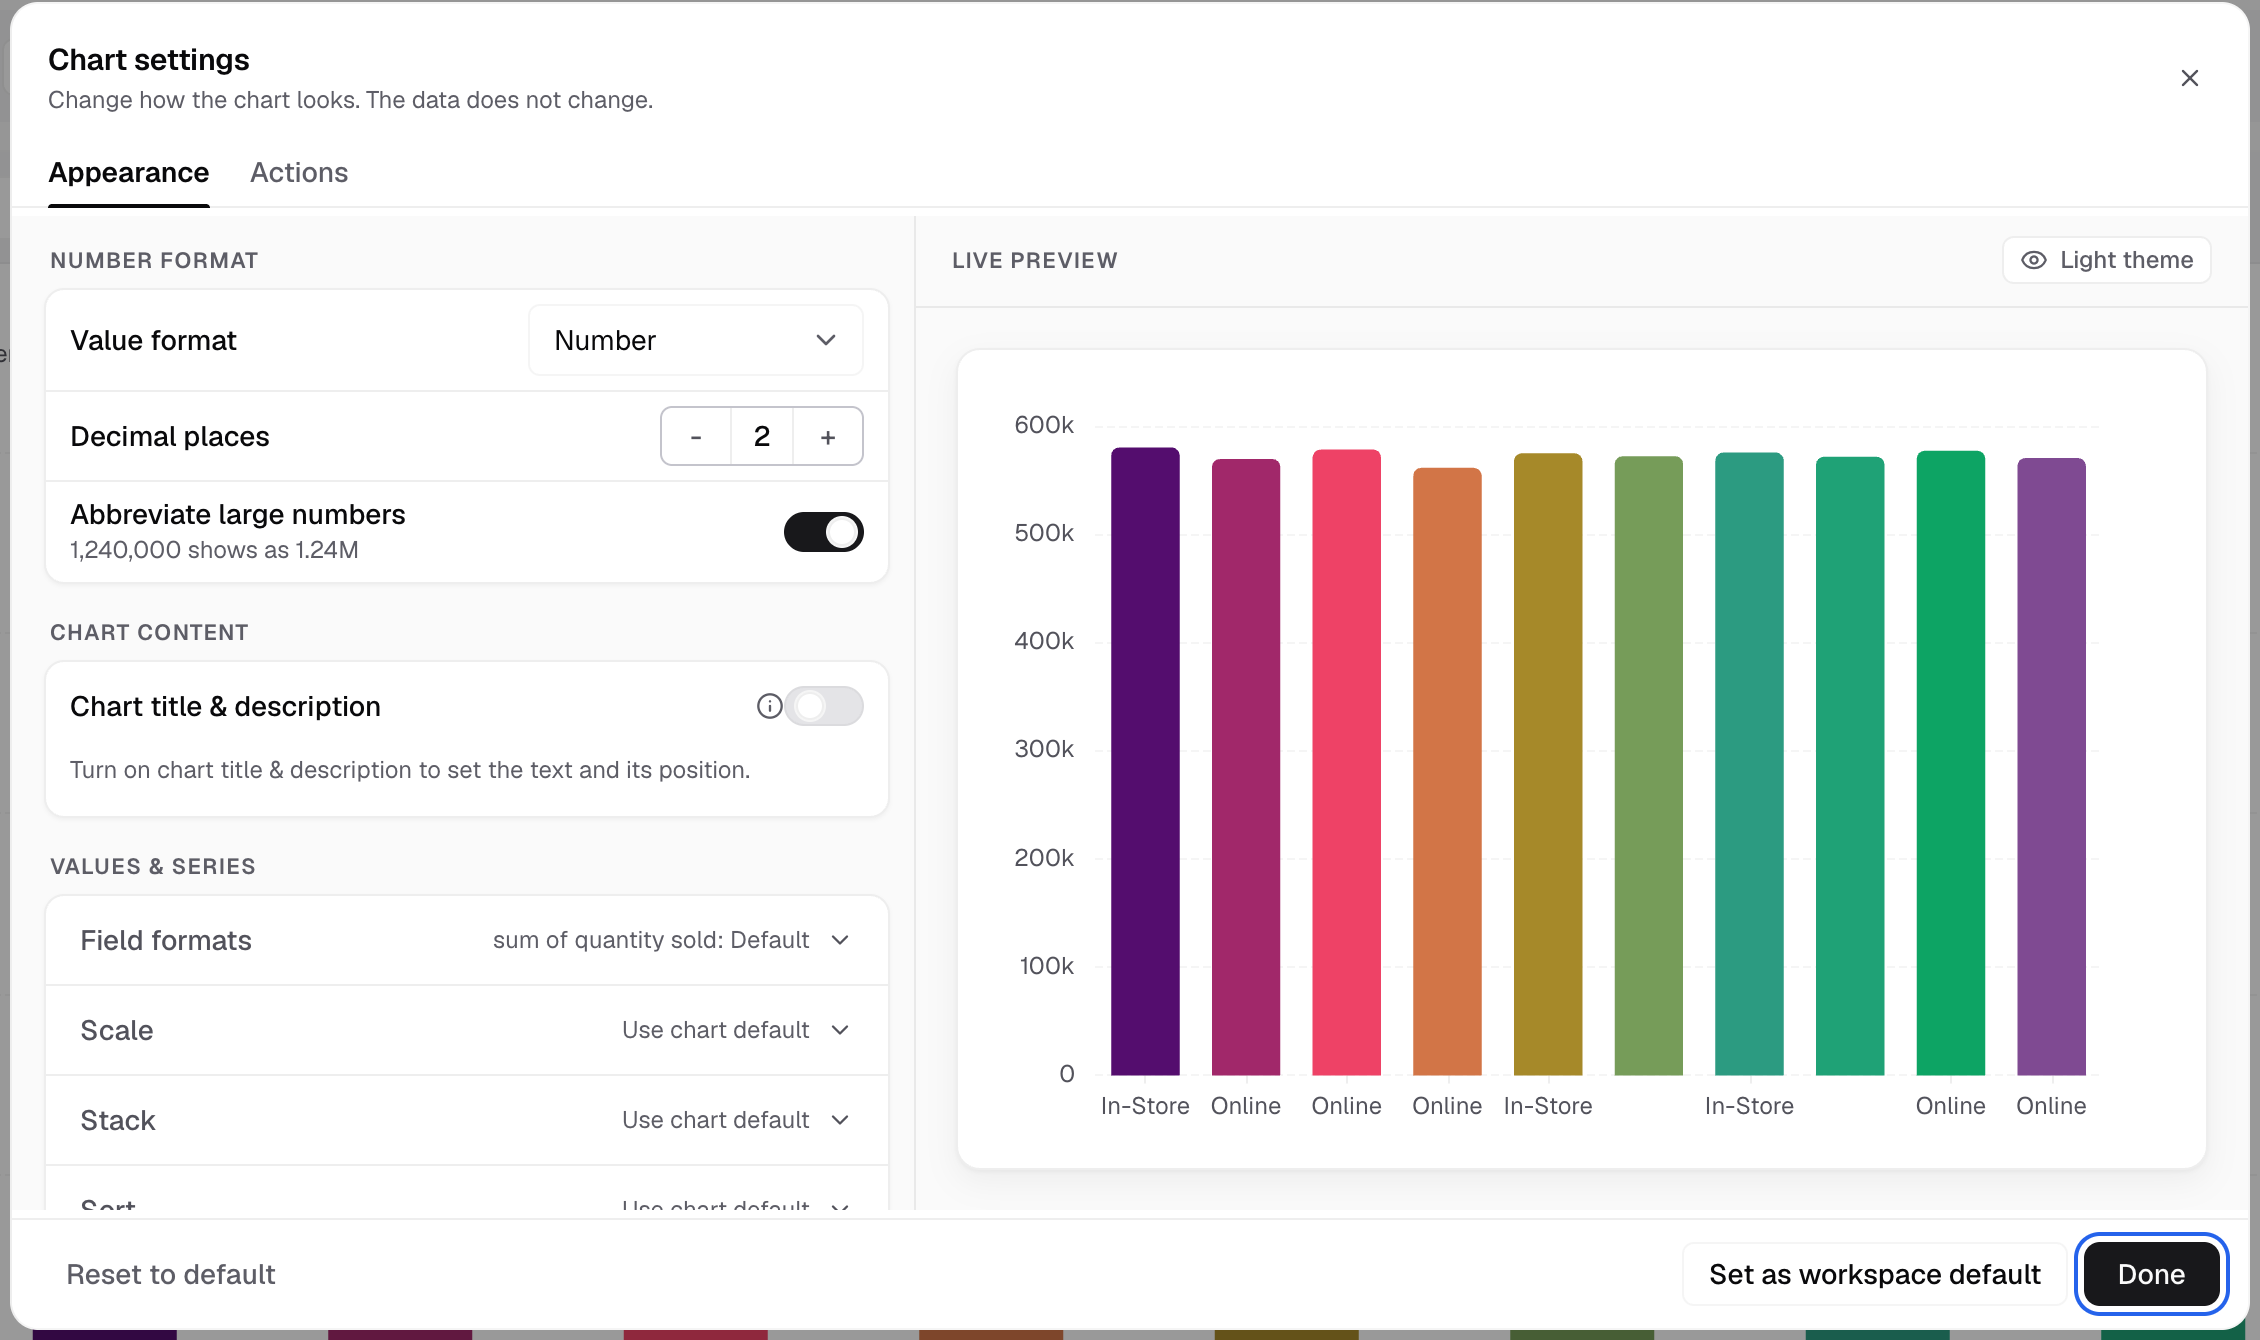
Done closes Chart settings. -
Save the metric to keep the change.
What is on the Appearance tab
The tab has these blocks, top to bottom. A chart shows only the blocks that apply to it.
| Block | What you set |
|---|---|
| Number format | Value format (Currency (USD), Number, Percent), Decimal places, Abbreviate large numbers. Every chart has it. |
| Chart content | Enable chart title & description: a title and description above or below the chart, with a Position. |
| Values & series | Field formats, Scale, Series axes, Stack, and Sort for bar charts. Line, bar, area and combo charts have it. |
| Chart elements | One section open at a time: Horizontal axis, Vertical axis, Chart markers, Chart legend, Chart colors, Formatting, Features, and more for some charts. |
| Advanced | Chart label (where values show), Chart margin, Bar styling (corner radius), Chart tooltip and Tooltip content. |
Single Value and the table charts have their own sections. See settings for each chart type.
Other tabs
- Variants: Pivot Table only. Choose V1, V2 or V3.
- Actions: what happens when a viewer selects the chart. See chart actions.
Reset or reuse your settings
- Reset to default puts this chart’s appearance back to the default.
- Set as workspace default makes these settings the default for this chart type in the workspace. The app confirms with “Saved as the workspace default for this chart type.”
Table and Horizontal Stack Table do not have these two buttons.
Ask Bryn
Bryn can change the chart type and add conditional formatting color rules. Bryn cannot change the other appearance settings. Set those in Chart settings.
If something goes wrong
- Appearance is greyed out. The chart is a Funnel. Funnel has no chart settings panel.
- The Appearance tab is greyed out. Drill down is on. Open each drill level to change its appearance.
- “No palettes yet.” Add chart palettes to the workspace theme in Settings. Create a theme
Next: settings for each chart type.