

Charts
Pick a chart type
Choose how a metric's result is drawn, then change how the chart looks.
Pick a chart for your metric. Databrain sorts the chart types by how well they fit the result.
Before you start
- You have a metric open in the metric builder, and it shows a result. Create a metric
Steps
-
Add the fields you want to Dimensions and Measures.
-
In the chart toolbar, select Chart type.
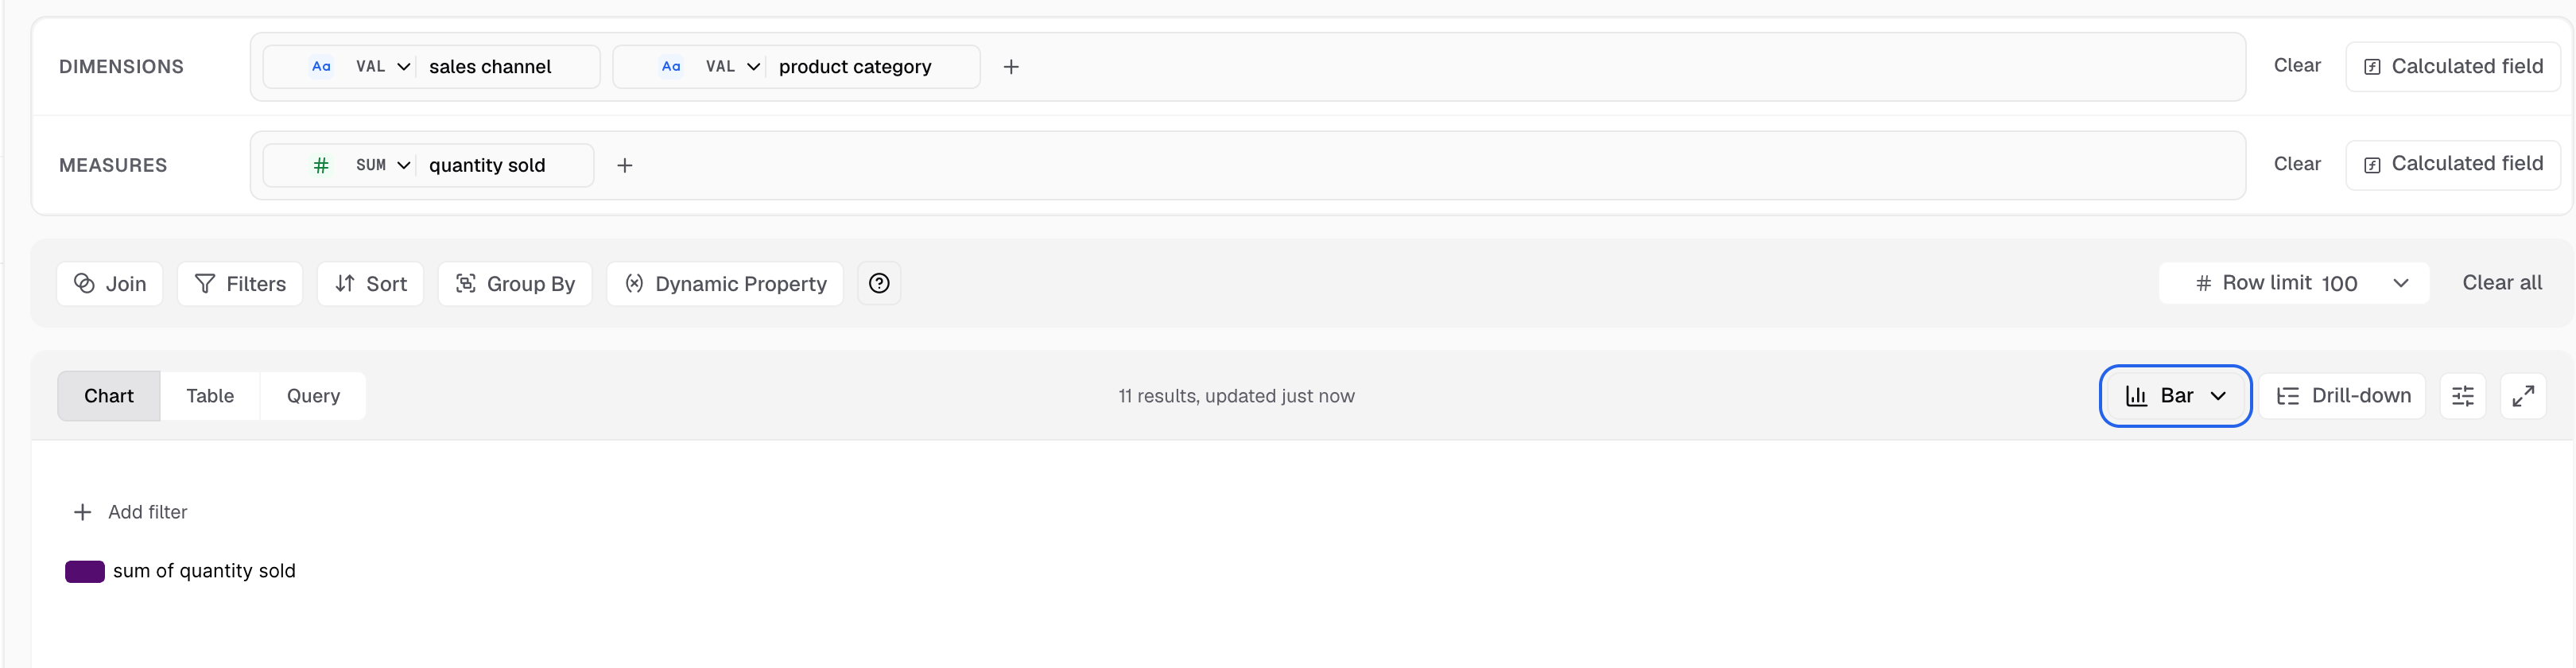
The Chart type button shows the current chart, here Bar. -
Look at the groups in the picker:
- Recommended: the best fit for the columns in this result.
- Also possible: these can draw the result, but are not the first choice.
- Not suited to this result: most of these stay selectable. Each one says what it needs.
- Custom: your company’s published custom charts.
-
Hover over a tile to see a preview of that chart.
-
Select a chart type. To find one fast, type in Search chart types.
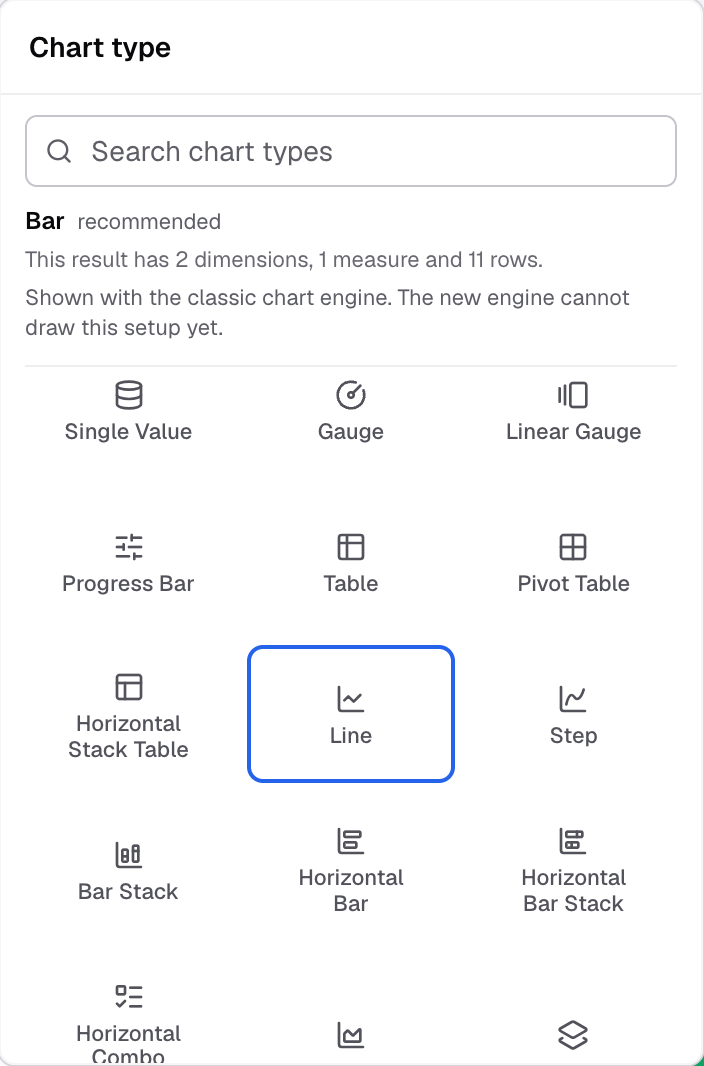
The picker groups the tiles by how well they fit the result. -
In the chart toolbar, select Appearance to open Chart settings.
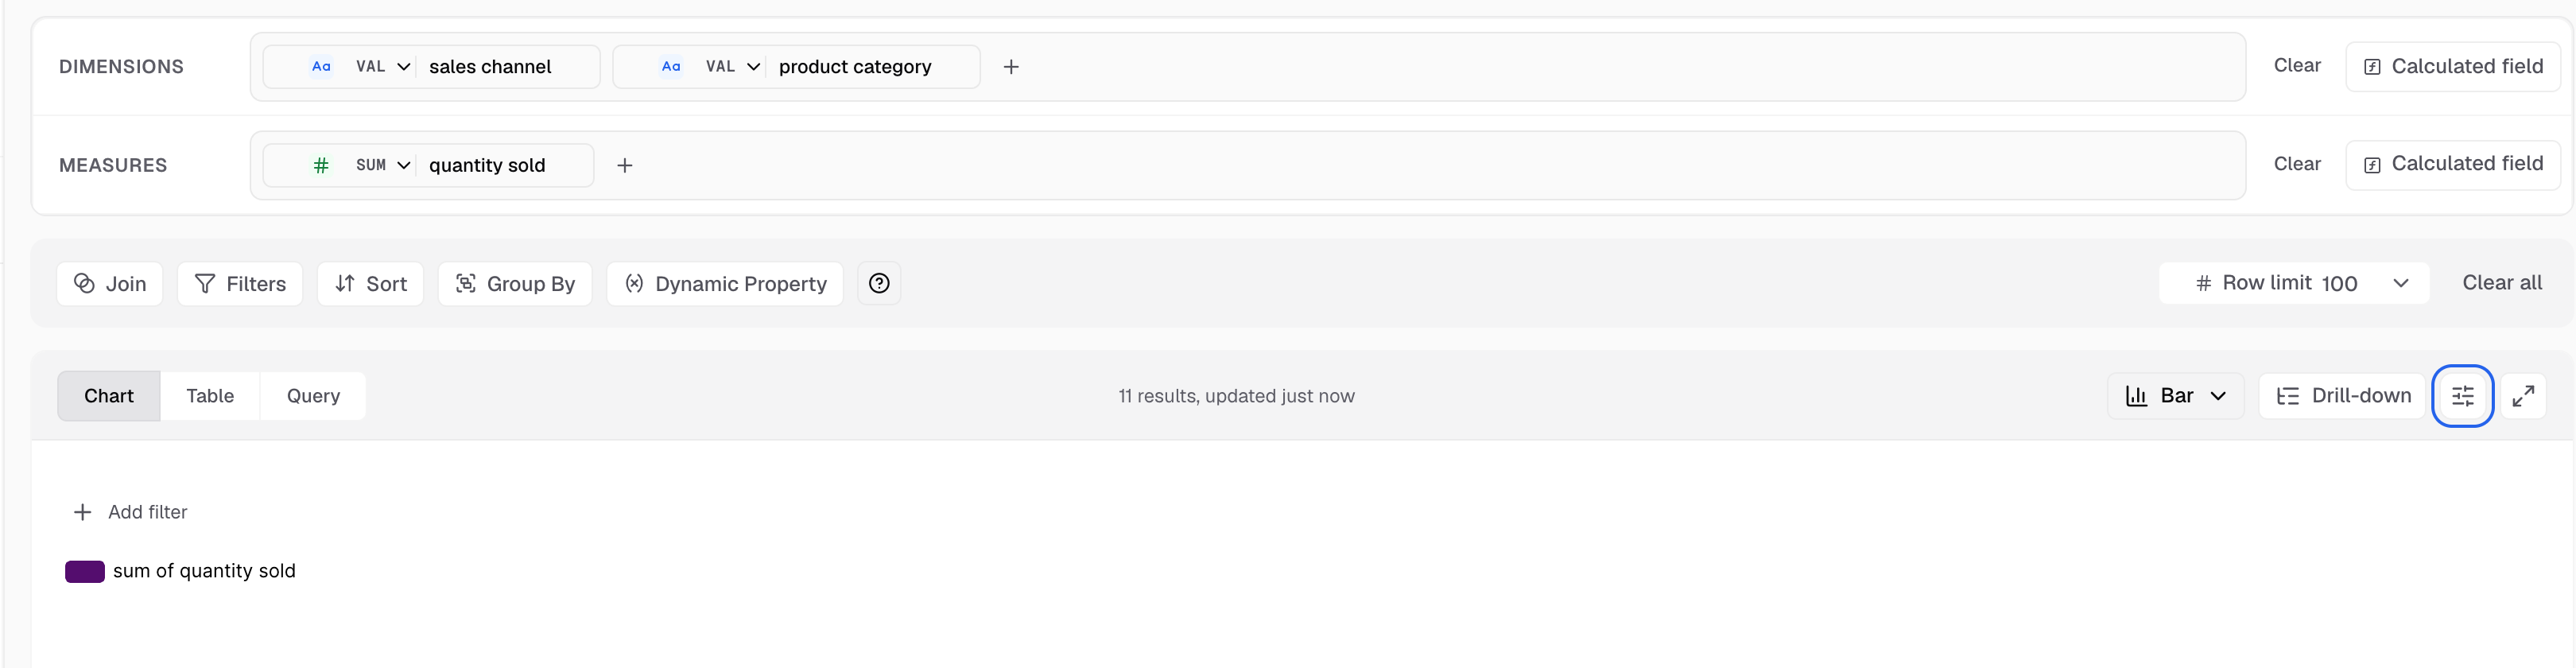
Appearance is the sliders icon next to Drill-down.
The chart redraws with the new type. The data does not change. Save the metric to keep it.
How the picker decides
- The line above the tiles names the chart, says what it needs, and says what this result has.
- A star marks the chart that Databrain recommends.
- A tile you cannot use for this result’s shape does nothing when you select it. It only shows the reason. For example, Time Series needs a date column.
- Chart types with old versions show one tile. For example, Pivot Table and Bubble each have one tile.
- With no rows in the result, only Table and Single Value fit.
For the data each chart needs, see the chart type list.
If something goes wrong
- Chart type is greyed out. Drill down is on. Open each drill level to change its chart type.
- Appearance is greyed out. The chart is a Funnel. Funnel has no chart settings panel.
- “No chart type matches that search”. Type a shorter word, or clear the search.
Next: change how the chart looks.