

Chart types
Chart types and the data they need
Every chart type in the picker, what each one needs, and where to set it up.
Each tile in the Chart type picker needs a certain shape of data. Find your chart below, then open its setup page.
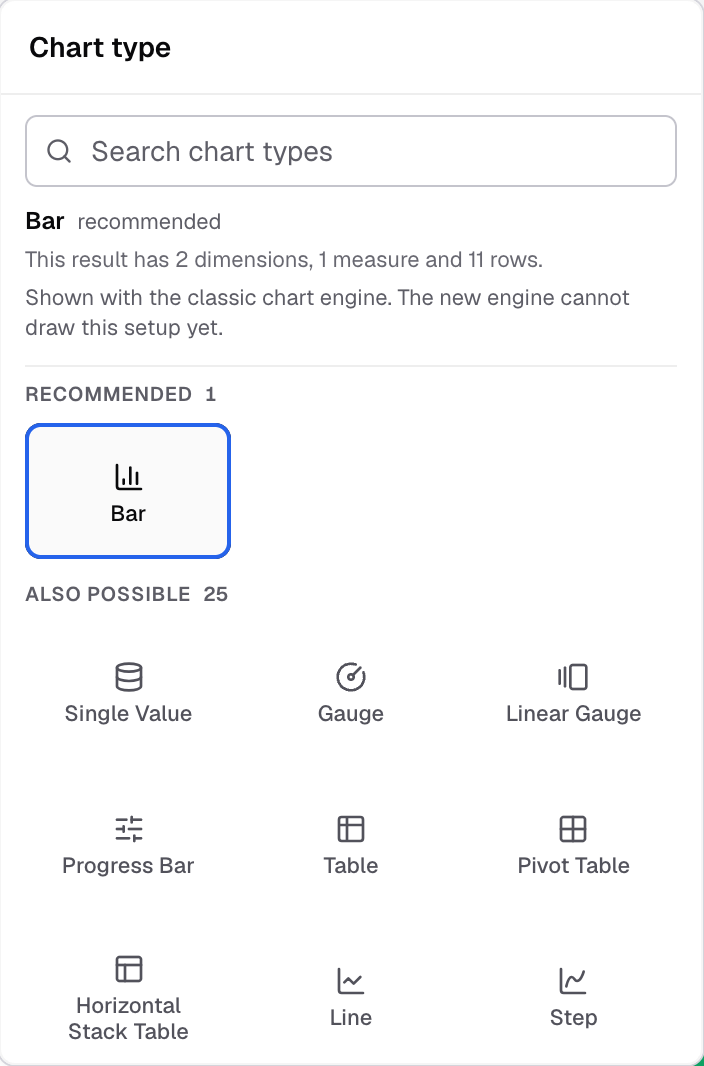
In the metric builder you add fields to Dimensions and Measures. Databrain puts them into the chart in that order. For most charts, the first dimension is the x axis and each measure is a series.
KPI cards
| Tile | What it needs | Setup page |
|---|---|---|
| Single Value | 1 column. A measure, or else the first dimension. Shows the first row. | Single Value |
| Gauge | 1 measure | Gauge, Progress Bar and Linear Gauge |
| Linear Gauge | 1 measure | Gauge, Progress Bar and Linear Gauge |
| Progress Bar | 1 measure. A second and third measure set the range. | Gauge, Progress Bar and Linear Gauge |
Tables
| Tile | What it needs | Setup page |
|---|---|---|
| Table | Any columns | Table and Horizontal Stack Table |
| Trend Analyzer | Any columns | Trend Analyzer |
| Pivot Table | 1 or more dimensions and 1 or more measures, grouped | Pivot Table |
| Horizontal Stack Table | 1 or more dimensions and 1 or more measures | Table and Horizontal Stack Table |
Line, bar and area
| Tile | What it needs | Setup page |
|---|---|---|
| Line, Step, Bar, Horizontal Bar, Area | 1 dimension (x axis) and 1 or more measures | Line, bar and area charts |
| Bar Stack, Horizontal Bar Stack, Stacked Area | 1 dimension, 1 or more measures, and a second measure or second dimension to stack by | Line, bar and area charts |
| Time Series | A date or time dimension and 1 or more measures | Time Series |
| Hybrid Bar | 1 dimension and 2 or more measures, grouped | Hybrid Bar |
| Gantt | 4 dimensions in this order: lane, task, start, end, grouped | Gantt |
Combo
| Tile | What it needs | Setup page |
|---|---|---|
| Combo (Multi-Scales), Horizontal Combo (Multi-Scales), Combo (Single-Scale) | 1 dimension and 2 or more measures | Combo charts |
| Horizontal Combo (Single-Scale) | 1 or more measures | Horizontal Combo (Single-Scale) |
Pie
| Tile | What it needs | Setup page |
|---|---|---|
| Pie, Doughnut, Rose | 1 dimension and exactly 1 measure | Pie, Doughnut and Rose |
Distribution
| Tile | What it needs | Setup page |
|---|---|---|
| Histogram | 1 dimension that holds buckets from your SQL, and exactly 1 measure | Histogram |
| BoxPlot | 5 measures in this order: min, q1, median, q3, max | BoxPlot |
| Scatter | 1 dimension and 2 or more measures | Scatter, Bubble and Radar |
| Radar | 1 dimension and 3 or more measures | Scatter, Bubble and Radar |
| Bubble | 2 dimensions (x, y) and 1 measure (size) | Scatter, Bubble and Radar |
Funnel and flow
| Tile | What it needs | Setup page |
|---|---|---|
| Funnel, Waterfall | 1 dimension and exactly 1 measure | Funnel, Sankey and Waterfall |
| Sankey | 2 dimensions (source, target) and 1 measure (value) | Funnel, Sankey and Waterfall |
| Network | 2 dimensions (source, target) and 1 measure (value) | Network |
Hierarchy and maps
| Tile | What it needs | Setup page |
|---|---|---|
| Tree map | 1 or more dimensions and 1 or more measures, grouped | Tree map |
| Indian States, USA States, USA States (with bar), World map | 1 dimension that names a place on the map, and exactly 1 measure, grouped | Maps |
| USA States (with Scatter) | As above, plus columns named longitude and latitude | Maps |
Custom
Your company’s published custom charts show in the Custom group. Each one names its own data slots. Build a custom chart
“Grouped” means the metric has a measure with an aggregate and at least one dimension. Charts marked grouped do not show until the metric is grouped.
Next: pick a chart type.