

Chart types
Set up a line, bar or area chart
Compare measures across categories or dates with a line, bar or area chart.
Show one or more measures along an x axis. This page covers Line, Step, Bar, Bar Stack, Horizontal Bar, Horizontal Bar Stack, Area and Stacked Area.
Before you start
- You have a metric open in the metric builder. Create a metric
What the data needs
| Chart | Dimensions | Measures |
|---|---|---|
| Line, Step, Bar, Horizontal Bar, Area | 1, the x axis | 1 or more. Each measure is a series. |
| Bar Stack, Horizontal Bar Stack, Stacked Area | 1, the x axis. A second dimension can split the stack. | 1 or more. With one dimension, add a second measure to stack. |
Steps
-
Add the x axis field to Dimensions, for example
month. -
Add one or more fields to Measures, for example
revenueandcost. -
In the chart toolbar, select Chart type.
-
Select the chart, for example Bar.
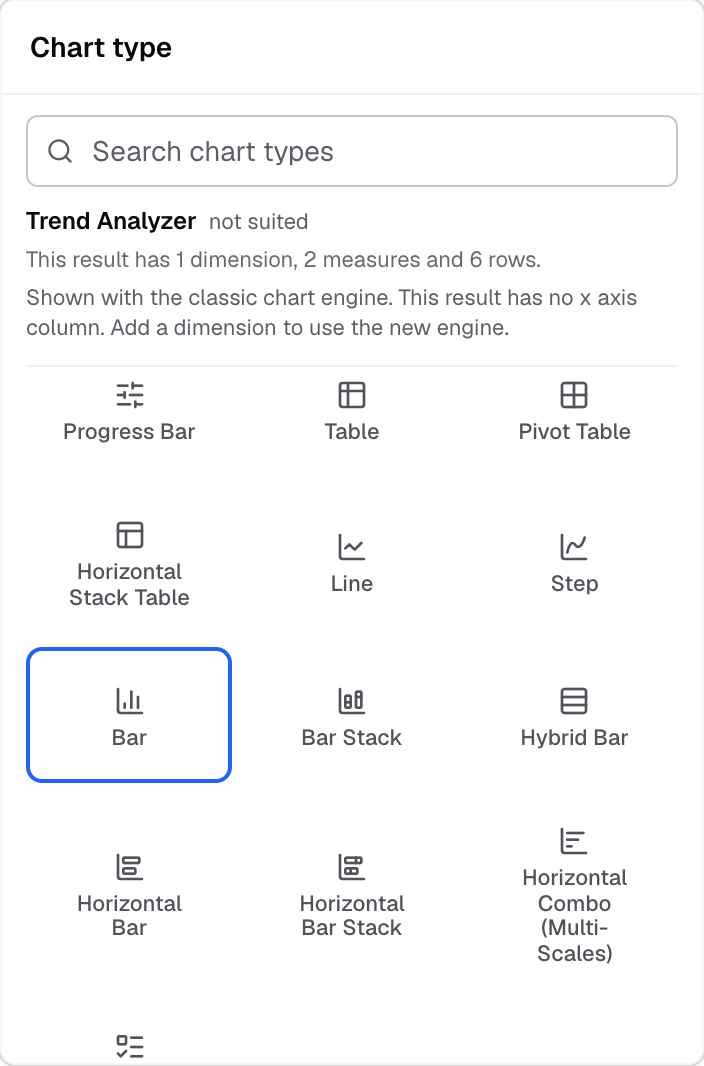
Bar in the Chart type picker. -
To change how it looks, select Appearance.
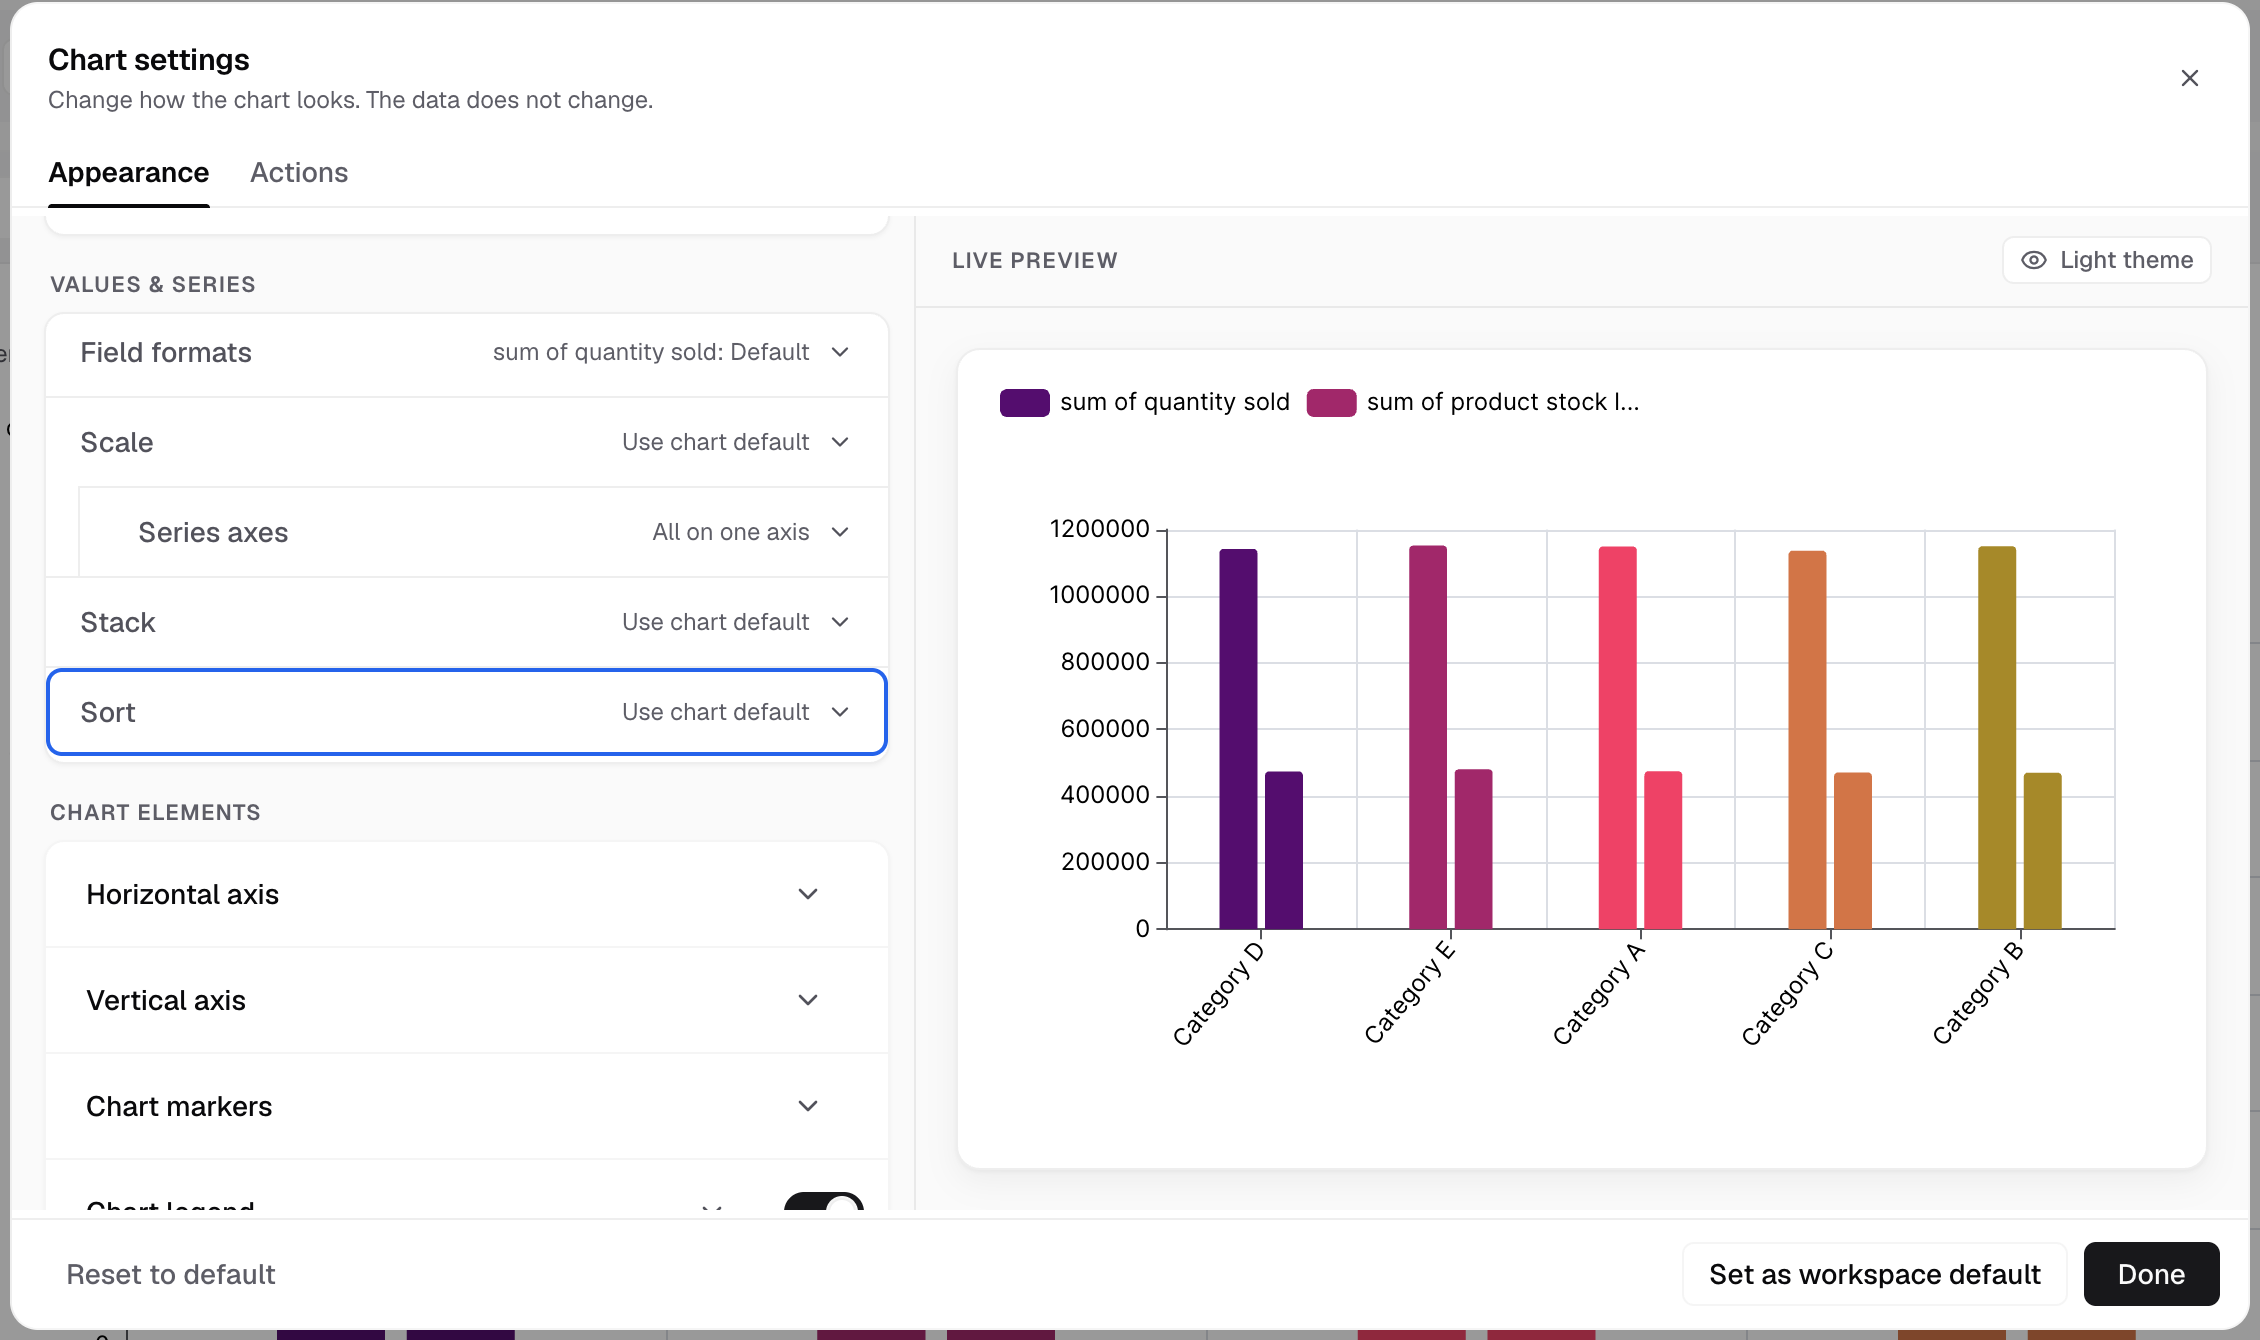
Values & series > Sort sorts the bars by category, value or stack total.
The chart shows one bar, line or area for each measure at each x axis value.
Settings you will use most
- Values & series > Sort (bar charts): sort by category, value or stack total.
- Values & series > Stack: Stack mode sets no stacking, stack from zero, center or 100%.
- Horizontal axis and Vertical axis: axis name, labels, label rotation and limits.
- Chart markers: mark the maximum and minimum values, and add Reference lines for a target.
- Features: Cumulative values, Limit data points, Chart zoom, and Smooth line for line and area charts.
Let viewers swap the axis fields with Actions > Add Actions On Current Card. Switch the x and y axis
Next: change how the chart looks.