

Chart types
Set up a combo chart
Show bars and lines together, on one scale or on separate axes.
Show some measures as bars and others as lines in one chart.
Choose a combo chart
| Tile | What it does |
|---|---|
| Combo (Multi-Scales) | Vertical. Each axis can have its own scale. |
| Horizontal Combo (Multi-Scales) | The same, with horizontal bars. |
| Combo (Single-Scale) | Vertical. All measures share one scale. |
| Horizontal Combo (Single-Scale) | Horizontal, one scale. See Horizontal Combo (Single-Scale). |
What the data needs
| Dimensions | Measures |
|---|---|
| 1, the x axis | 2 or more |
Set up a multi-scale combo
-
Add the x axis field to Dimensions, for example
month. -
Add two or more fields to Measures, for example
revenueandmargin_pct. -
In the chart toolbar, select Chart type, then Combo (Multi-Scales).
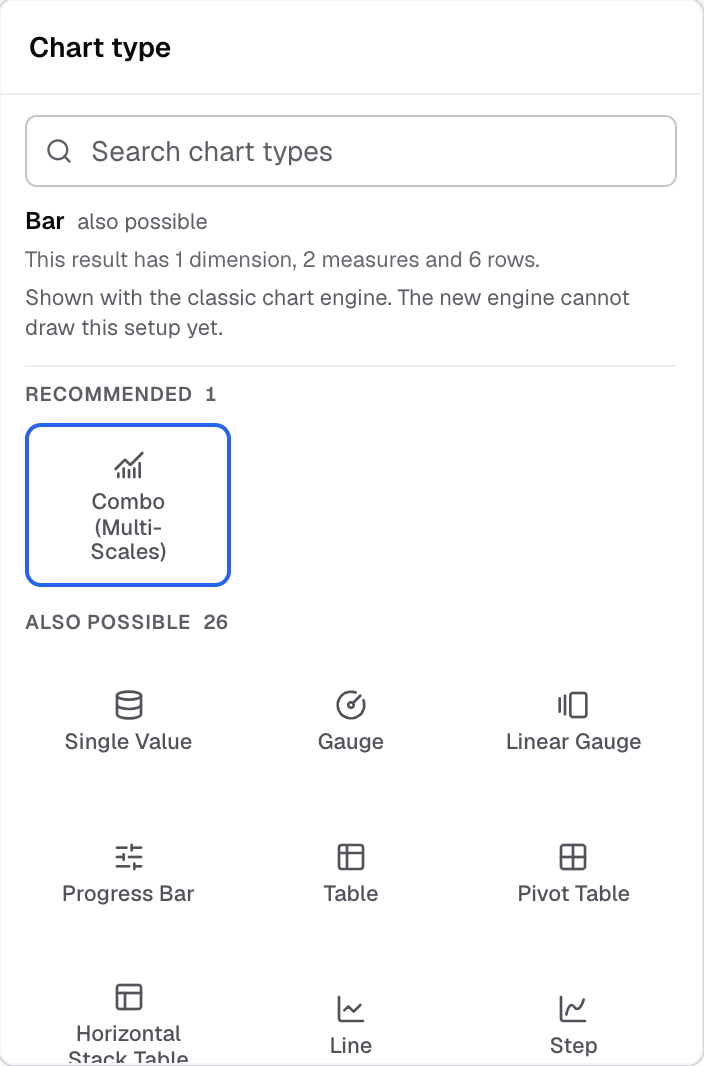
Combo (Multi-Scales) in the Chart type picker. -
Select Appearance, then open Combo chart settings.
-
In each axis card, choose the Measures for that axis.
-
Under Chart type (for example Chart type (sum of revenue)), choose Bar or Line.
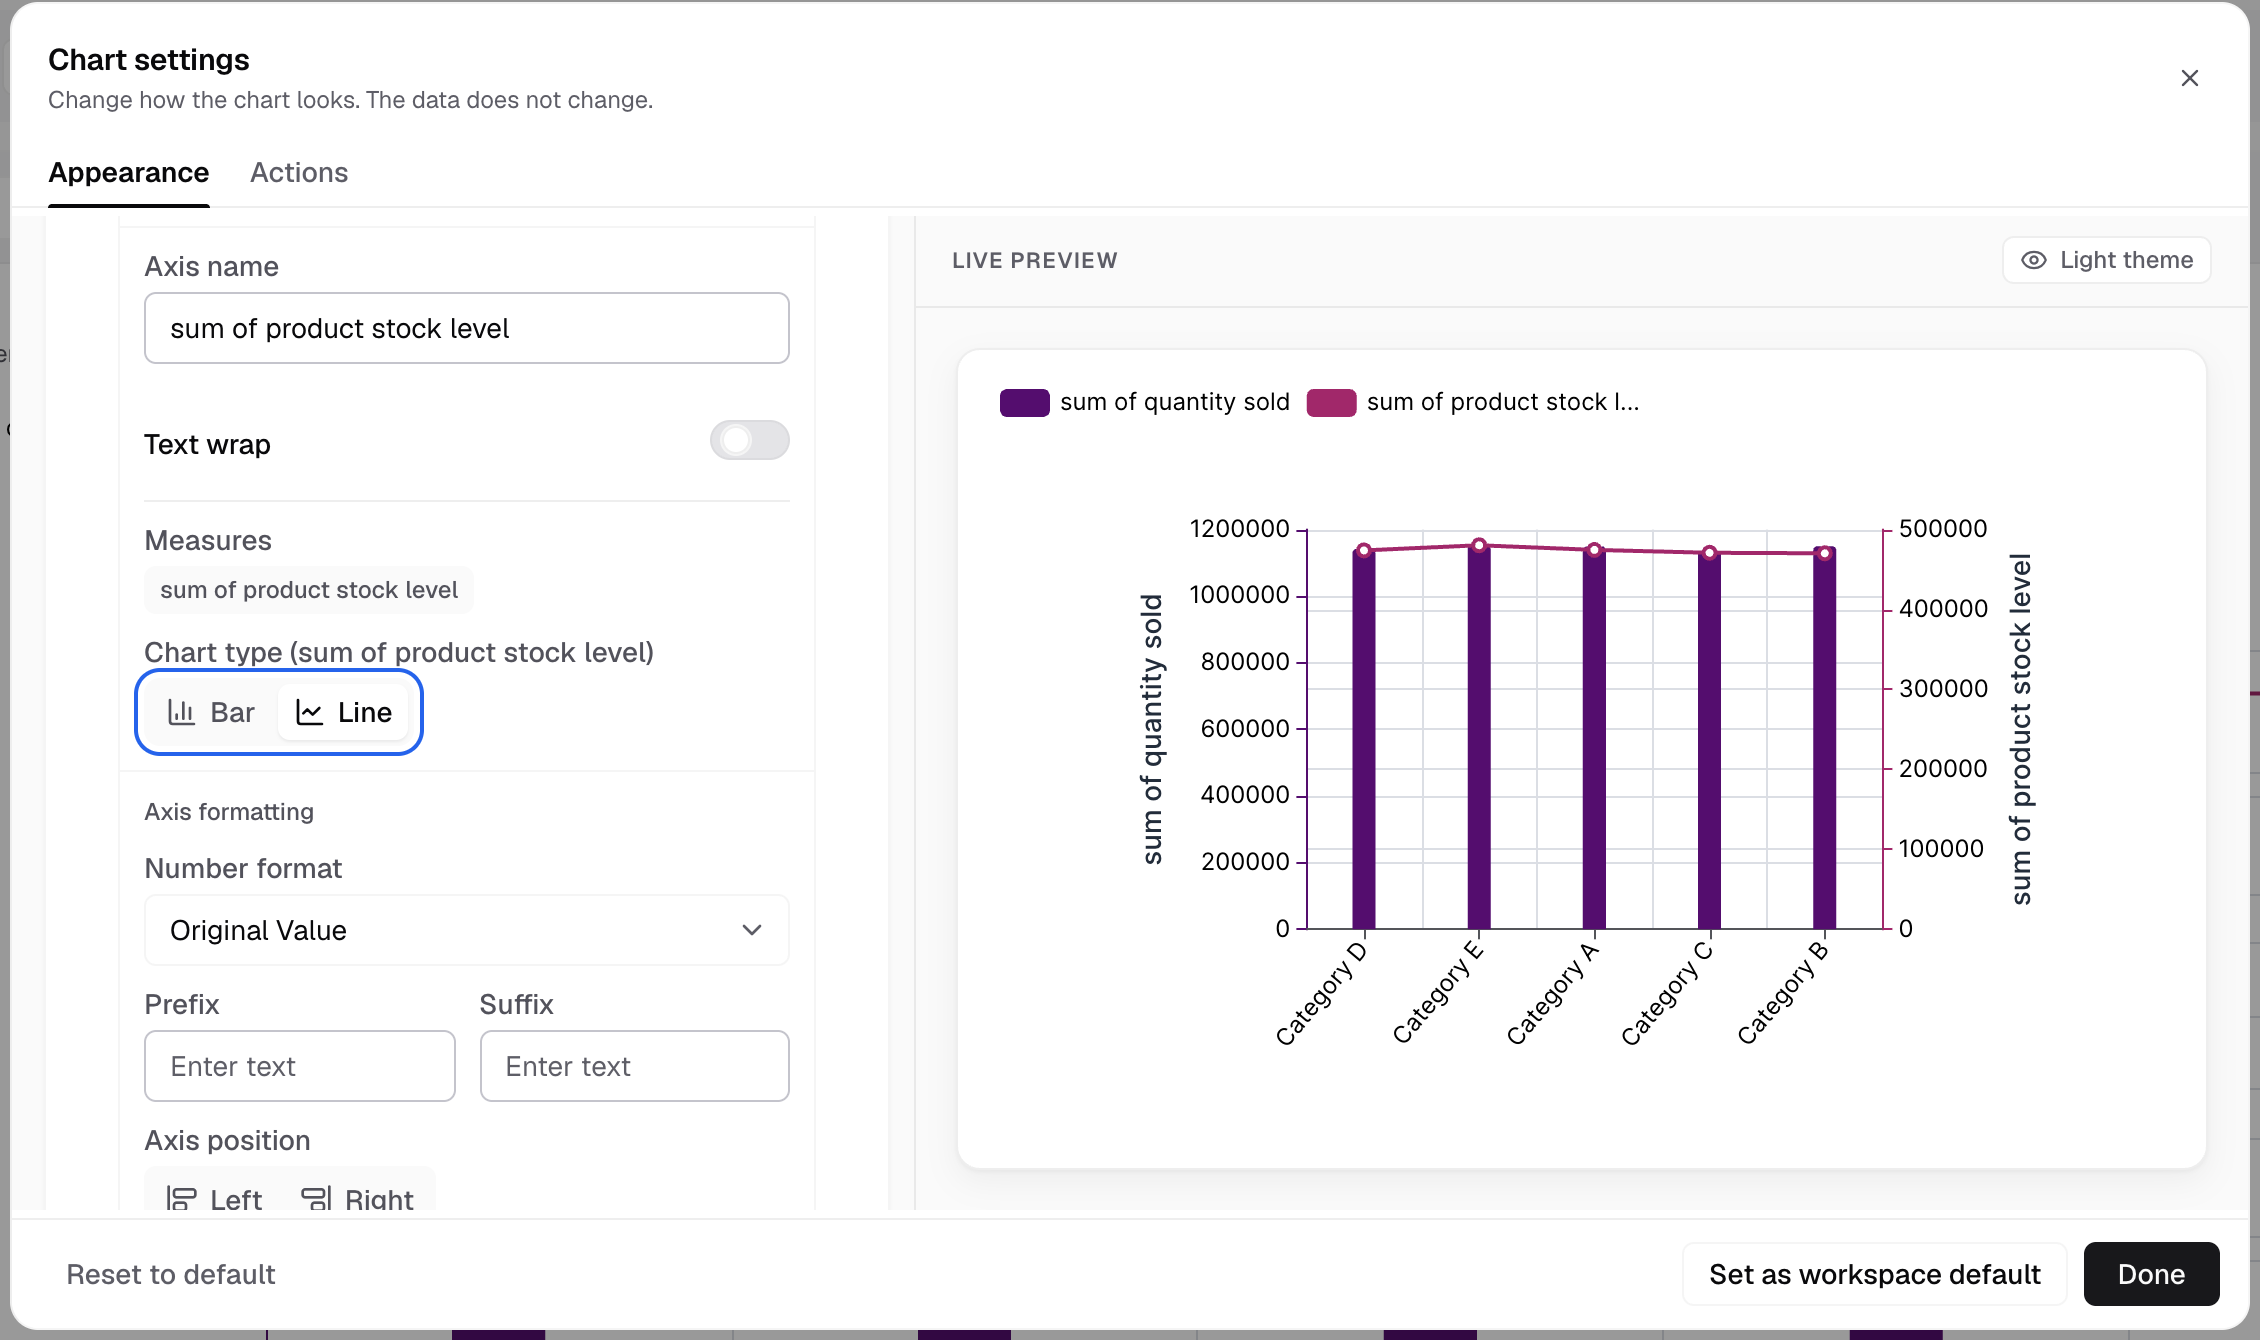
Each axis card has a Bar or Line choice for its measures. -
Scroll down the same card. Under Axis formatting, set Axis position.
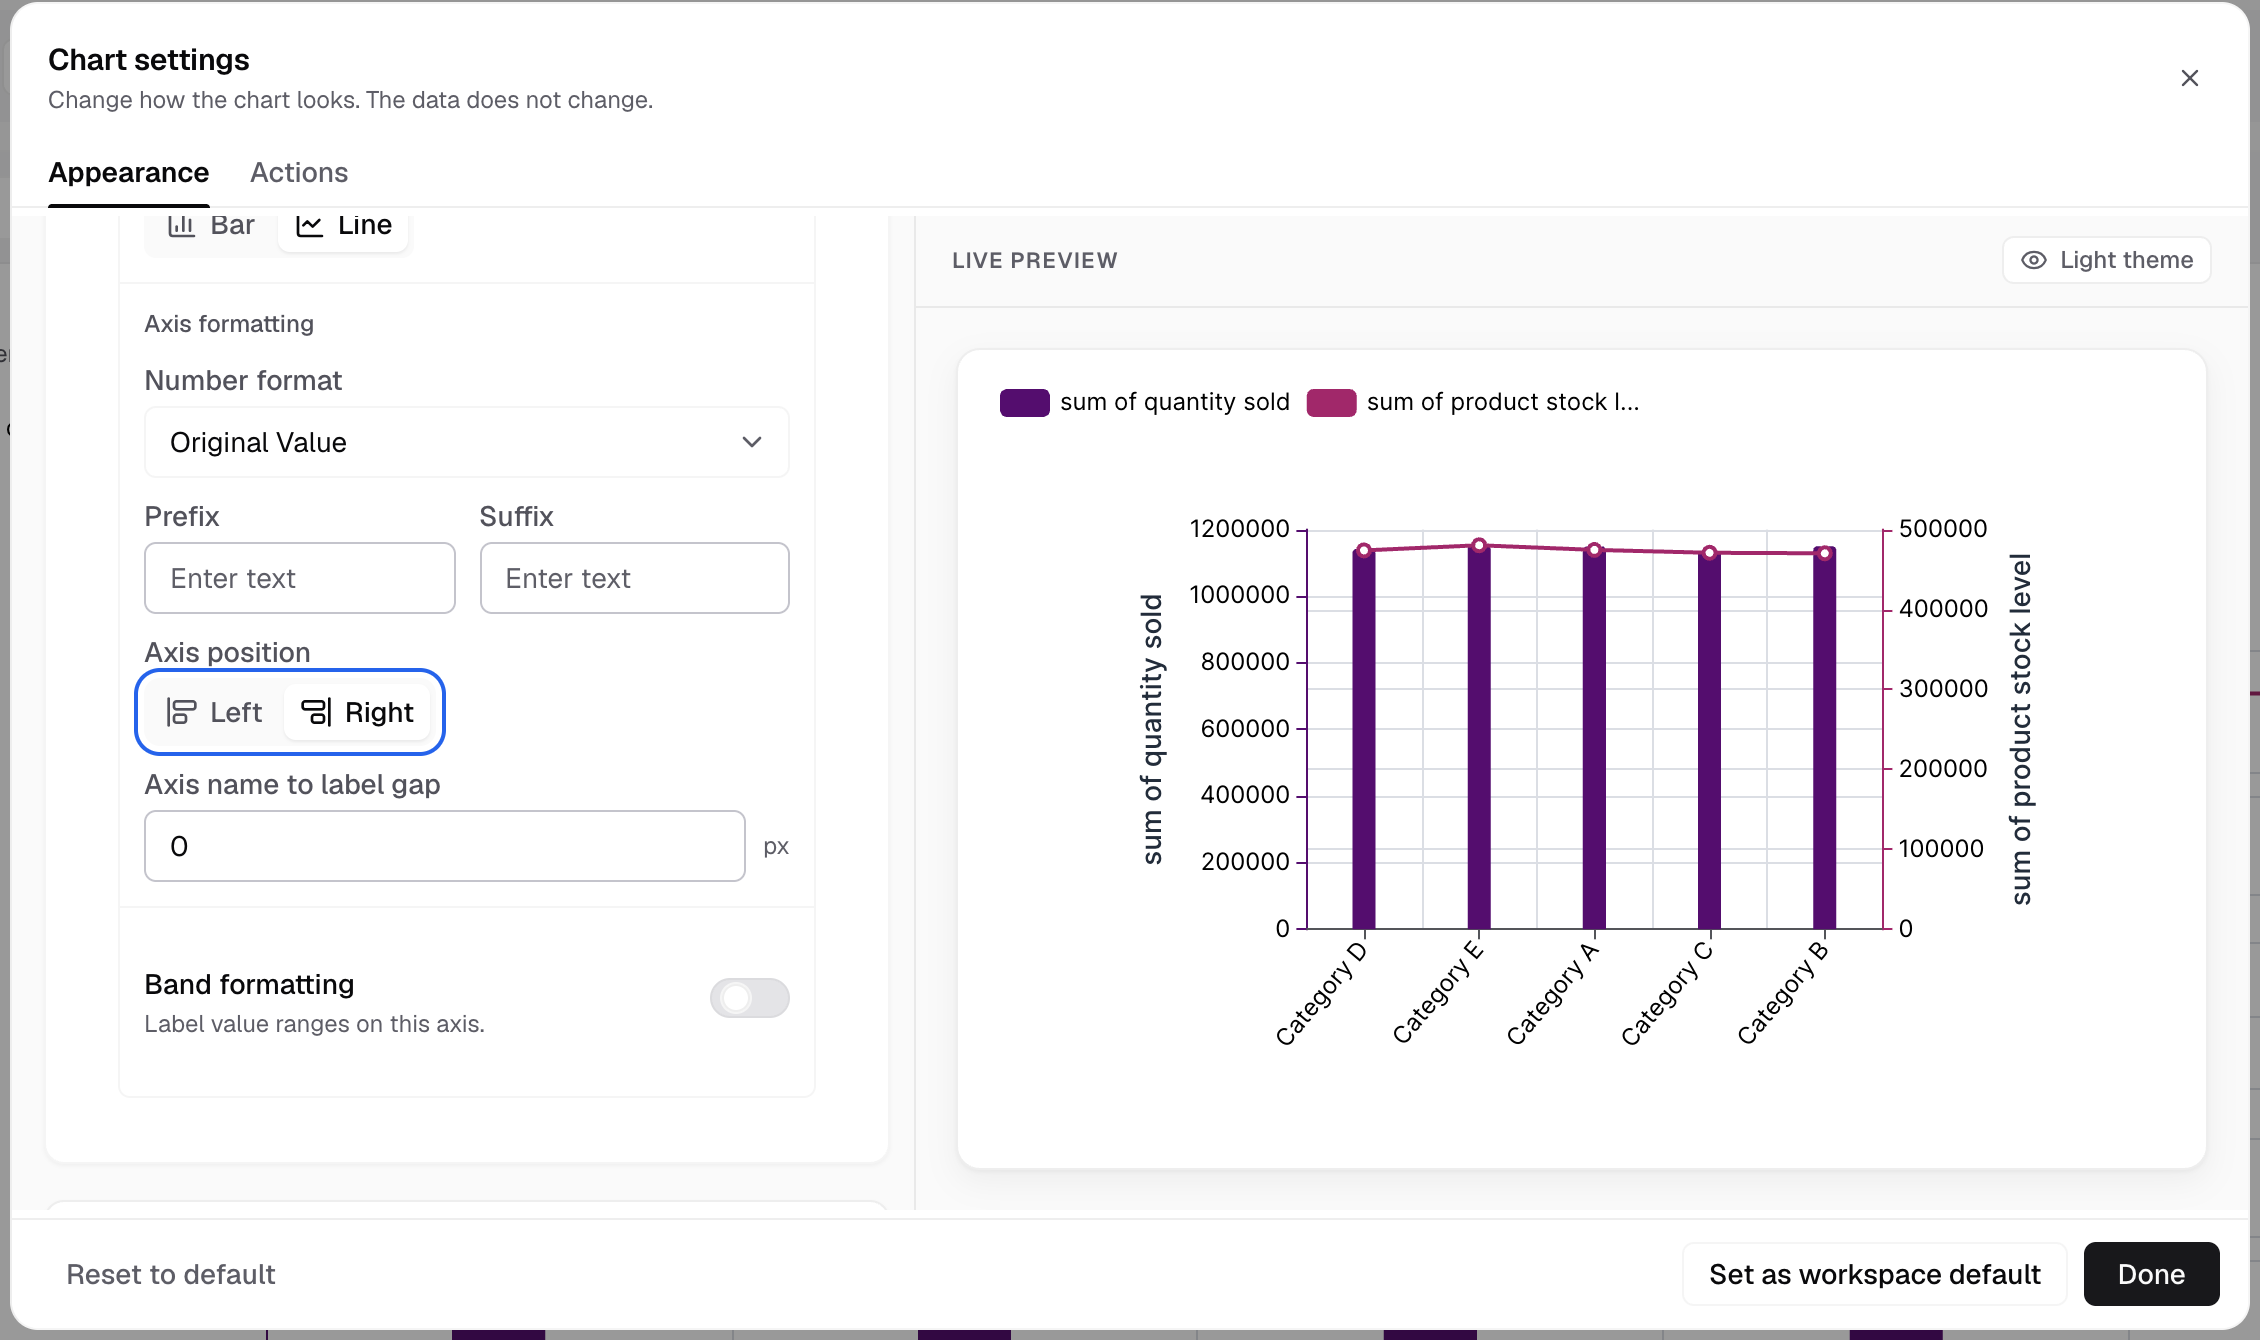
Axis position puts this axis on the left or the right.
Each axis has its own scale, so measures with different units stay readable.
Other settings in an axis card
Axis name, Text wrap, Stack bars, Bar background, Axis formatting (number format, prefix, suffix) and Band formatting. Use Merge axes to put two axes on one.
Set up a single-scale combo
- Add the x axis field to Dimensions and two or more fields to Measures.
- Select Chart type, then Combo (Single-Scale).
- Select Appearance, then open Features.
- Choose the measures to show in Dash markers and Line markers.
Next: change how the chart looks.