

Chart types
Set up a map chart
Color states or countries by a measure on an India, USA or world map.
Color each place on a map by one measure.
Choose a map
| Tile | What it shows |
|---|---|
| Indian States | States of India |
| USA States | States of the USA |
| USA States (with bar) | States of the USA, with bars |
| USA States (with Scatter) | States of the USA, with points from longitude and latitude columns |
| World map | Countries |
What the data needs
| Dimensions | Measures |
|---|---|
| 1 that holds place names the map knows, for example state names | Exactly 1, with an aggregate |
USA States (with Scatter) also needs columns named longitude and latitude.
Steps
-
Add the place field to Dimensions, for example
state. -
Add one aggregated field to Measures, for example
sum(revenue). -
In the chart toolbar, select Chart type, then select a map.
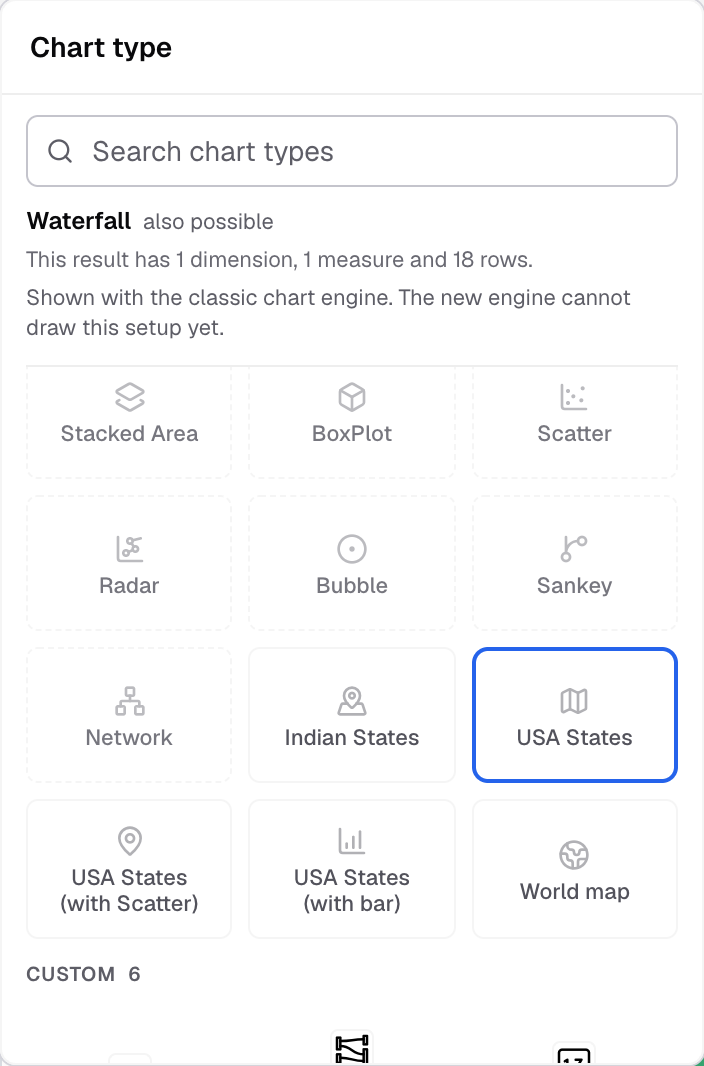
The map tiles are near the end of the Chart type picker. -
To change the colors, select Appearance and open Chart colors.
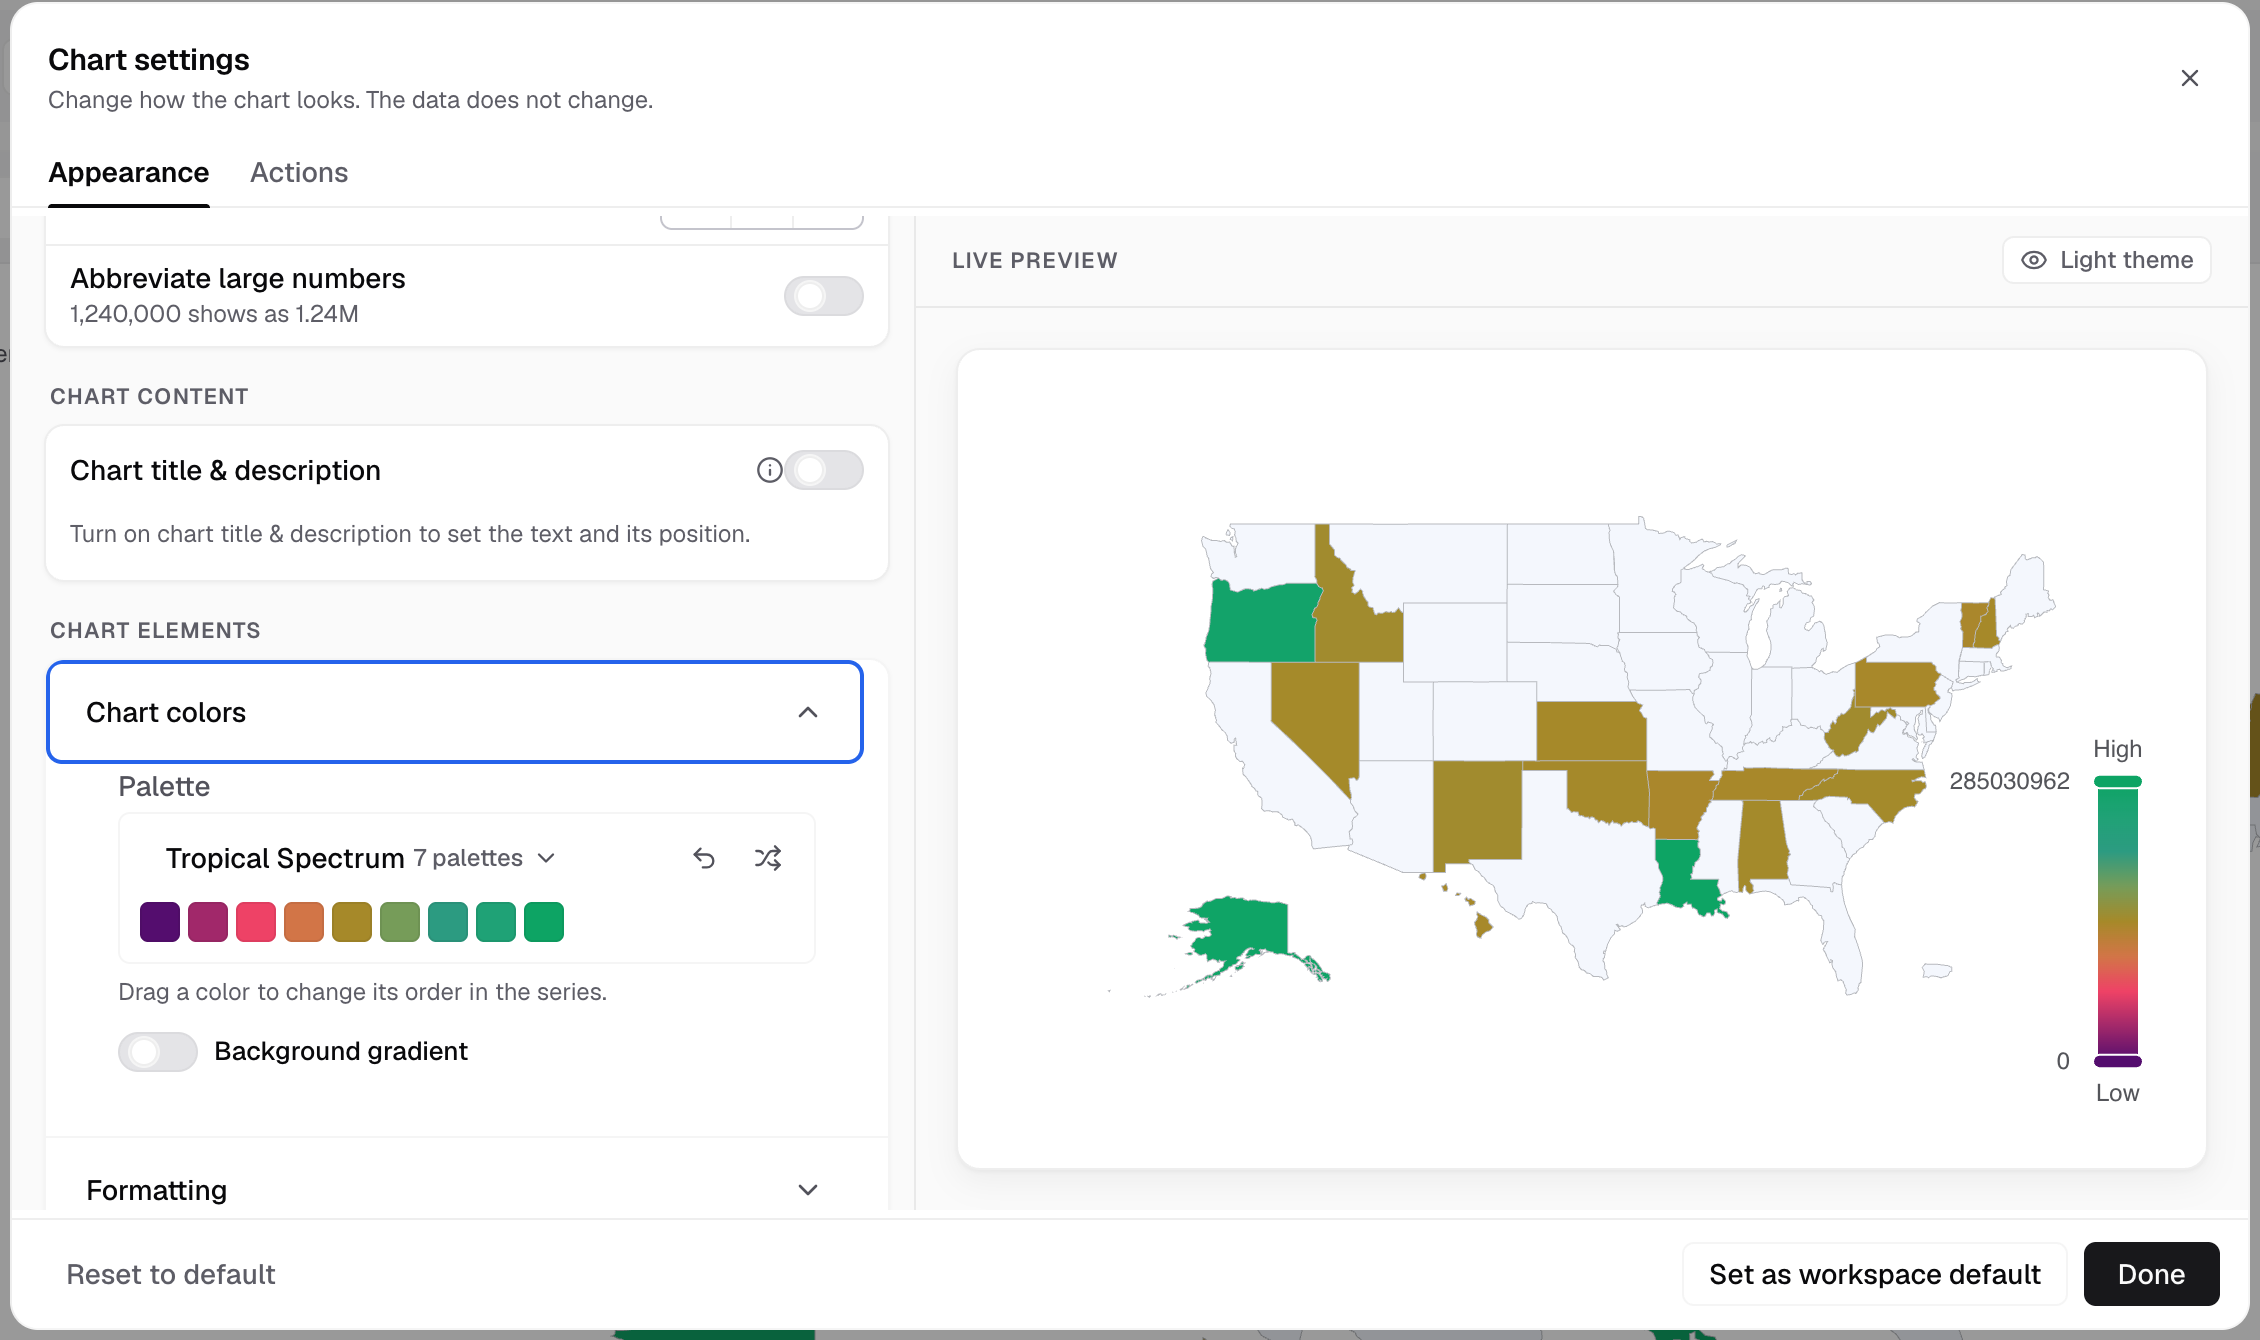
Chart colors sets the palette that colors each state.
Each place that matches a name on the map gets a color.
If something goes wrong
- The map tiles do not show. The metric is not grouped. Add an aggregate to the measure.
- A place stays empty. Its name in your data does not match the map. Change the value in the query.
Maps have no axes, legend, label or tooltip settings. Drill down does not work on maps.