

Chart types
Set up a histogram
Show how values spread across buckets that your query returns.
Show how many values fall in each bucket. Databrain does not make the buckets. Your query returns them.
What the data needs
| Dimensions | Measures |
|---|---|
1 that holds the buckets, for example 0-10, 10-20 | Exactly 1, for example a count |
Steps
-
Write the buckets in your query. For example:
SELECT FLOOR(order_value / 100) * 100 AS bucket, COUNT(*) AS orders FROM orders GROUP BY 1 ORDER BY 1 -
Add
bucketto Dimensions andordersto Measures. -
In the chart toolbar, select Chart type, then Histogram.
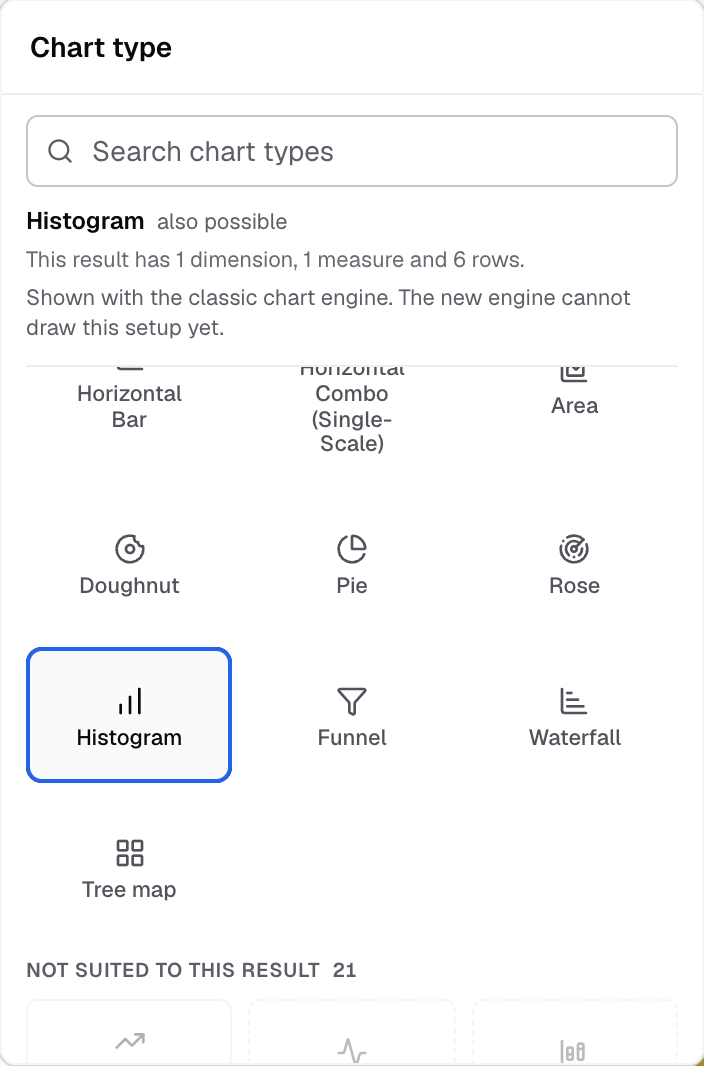
Histogram in the Chart type picker. -
To change how it looks, select Appearance.
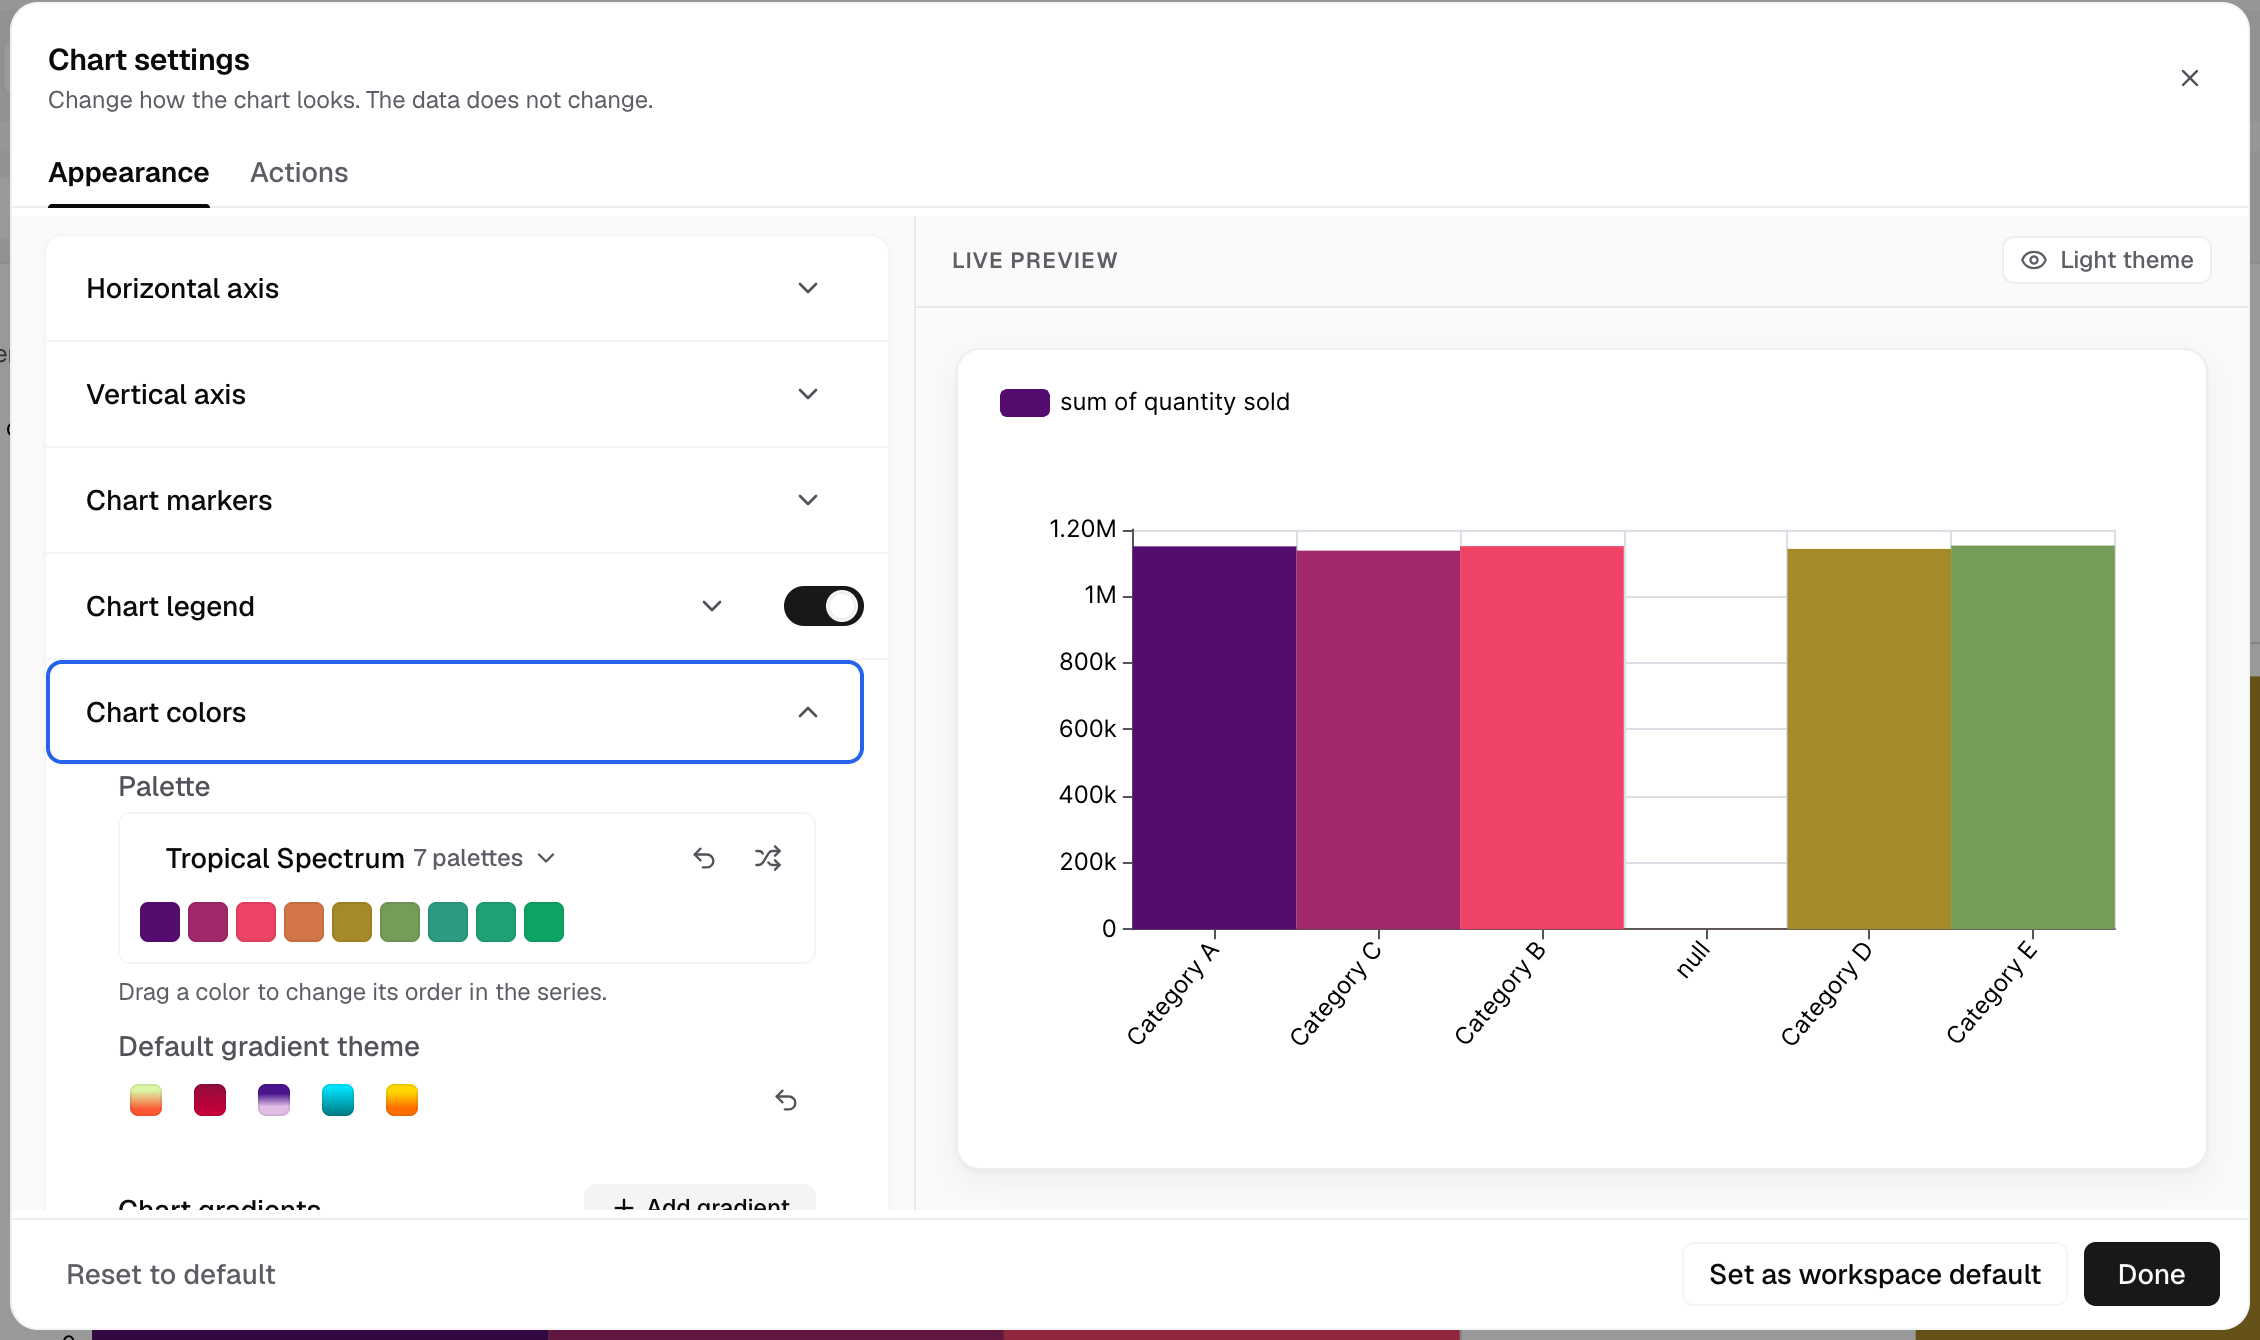
Chart colors sets the palette and gradients.
The chart shows one bar for each bucket.
Settings for this chart
- Chart colors has Random colors for bars and Bar background gradient.
- Features has Bar background, Limit data points and Chart zoom.
To write a query, see create a metric with SQL.