

Create a metric
Create a metric using SQL
Write a SQL query, run it, and turn the result into a chart or table.
Write a SQL query, run it, and turn the result into a chart or table.
Before you start
- You are an Admin, Editor or Developer. Viewers do not see the SQL tab.
- Your workspace has a connected datasource.
Steps
-
Go to Home and select New metric.
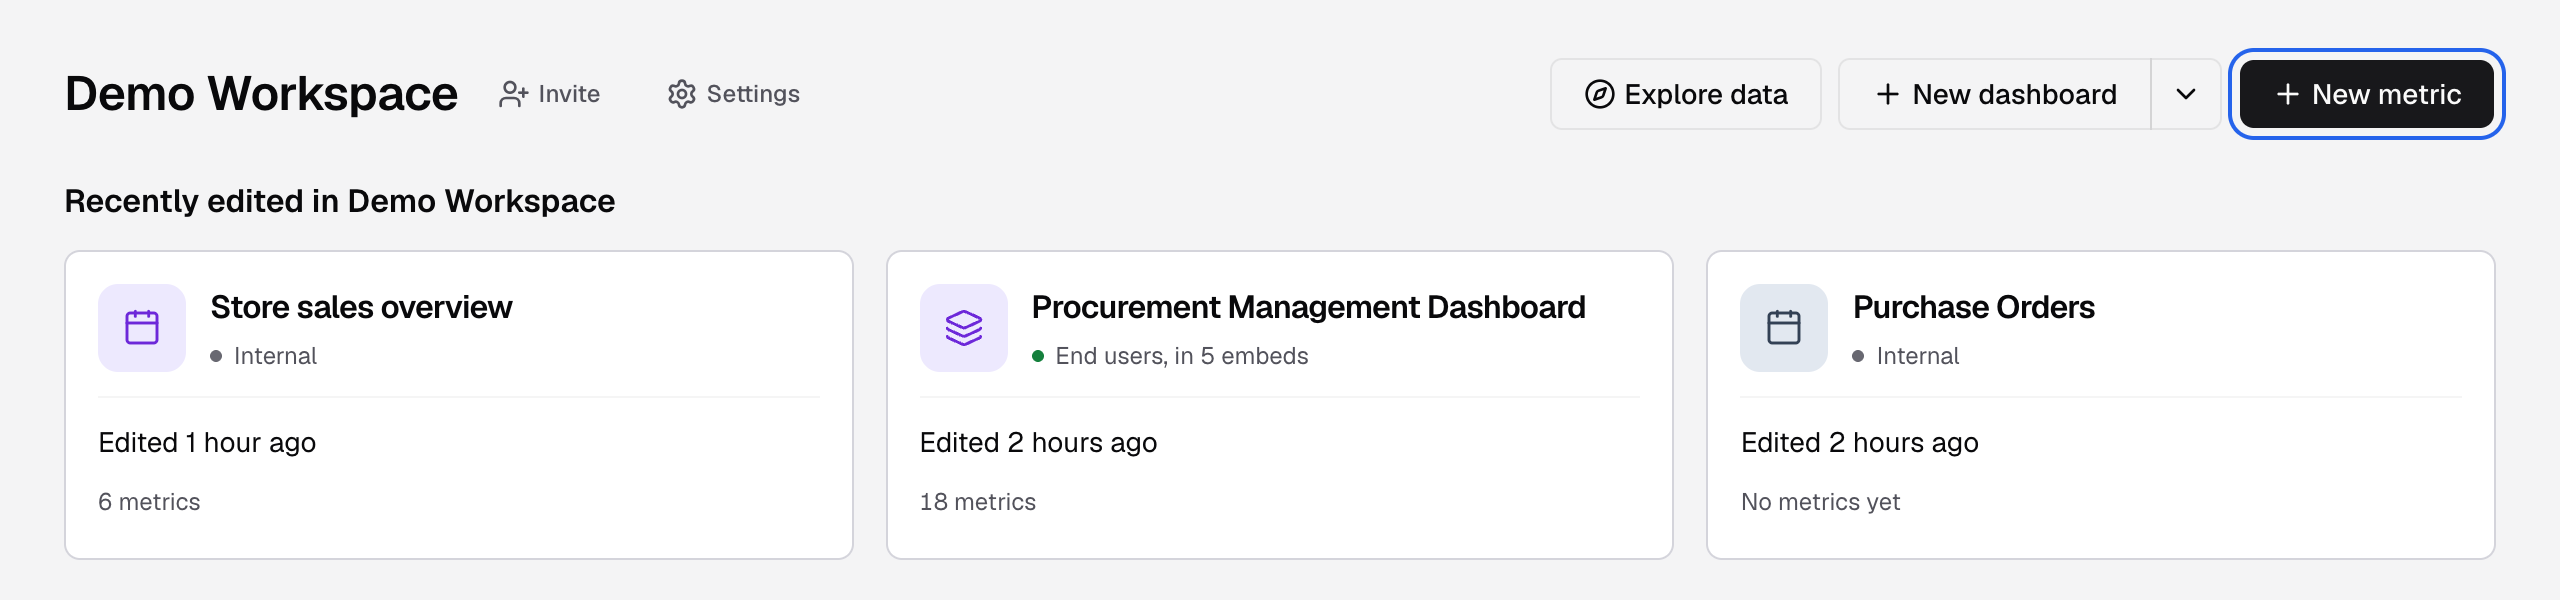
New metric is at the right of the workspace header on Home. -
In the left panel, select the SQL tab.
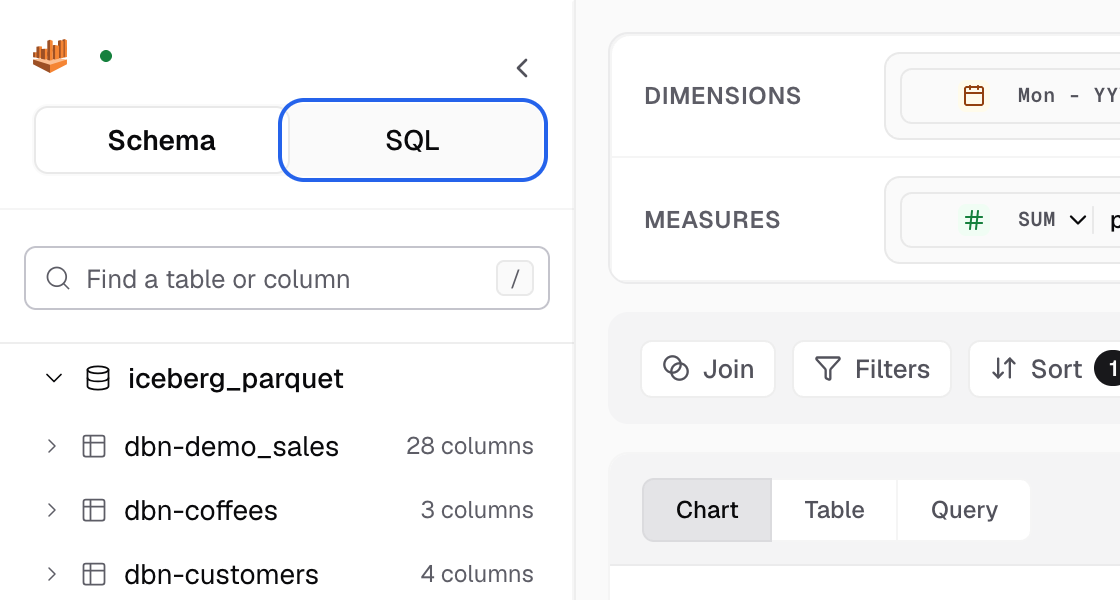
The SQL tab is next to Schema in the left panel. -
In Query editor, write a query, for example
SELECT "o"."status" AS "status", COUNT(*) AS "orders" FROM "public"."orders" AS "o" GROUP BY "o"."status".
Write the query in the Query editor. -
Select Run query. You can also press Cmd+Enter (Ctrl+Enter on Windows).

Run query is at the right of the editor toolbar. -
Check the rows in Query result.

Query result shows the row count and the rows. -
Select Use results.

Use results is at the right of the Query result bar. -
In Use result as, choose New chart, then select Continue.
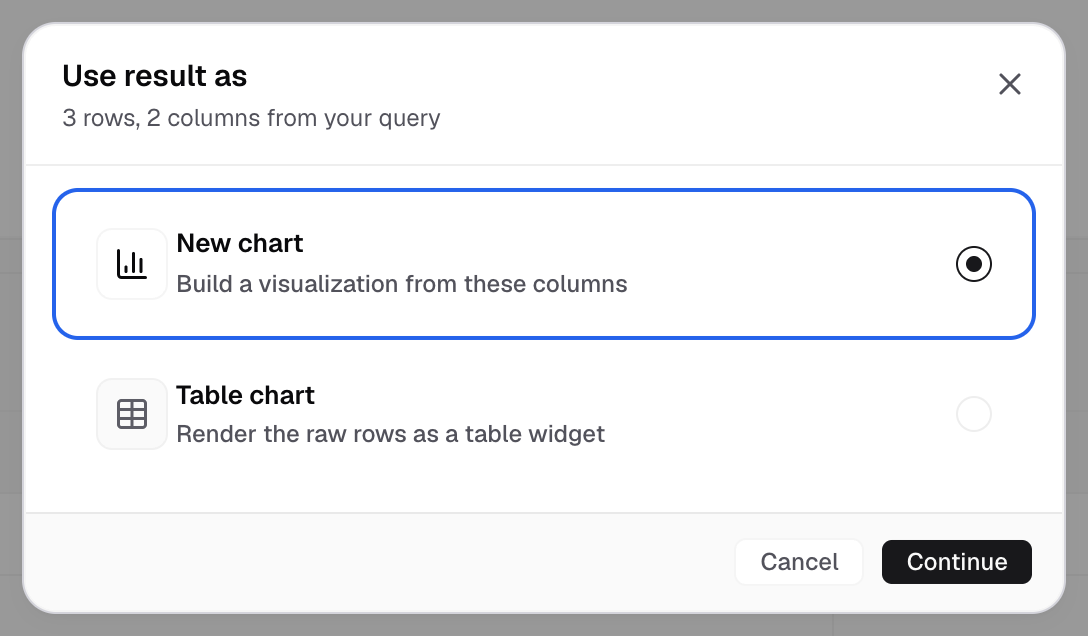
Use result as: New chart is picked by default. -
Set up the chart, then select Save to dashboard.
-
Fill in the save dialog and select Save and add to dashboard.
The metric is saved with your SQL. For the save fields, see Create a metric.
Use result as
| Option | What you get |
|---|---|
| New chart | Build a chart from the result columns. |
| Table chart | Show the raw rows as a table. Select Make it a dynamic table to run the query again each time the dashboard loads. |
| Custom dataset | Publish the result as a reusable dataset. The dialog is Publish as Custom Dataset. |
Custom dataset is not shown for Python, for Elasticsearch or OpenSearch, in a workspace on a datamart, or without permission to create custom datasets.
Query rules
The editor runs read-only queries only:
- One statement that starts with
SELECTorWITH. - No
INSERT,UPDATE,DELETE,MERGE,CREATE,ALTER,DROP,TRUNCATE,GRANTor other write commands. - Give every column, table and subquery an alias with
AS, and put identifiers in double quotes, for example"schema_name"."table_name" AS "alias_name". Instructions in the editor shows these rules. - MSSQL and Microsoft Fabric: no
WITHqueries here. Use a subquery.ORDER BYneedsTOPorOFFSET/FETCH. - To use a dynamic value, write
[[name]]in the query. Dynamic property
Editor tools
- Format query tidies the SQL for your database. It does not use AI. You can undo it.
- Download as CSV saves the rows in Query result as
query_result.csv. - Chart builder hides the editor and shows the chart.
- Exit SQL mode goes back to the schema builder. Your SQL and its results stay on the page.
- The Query language menu switches between SQL and Python. Python runs with Run code.
You need edit rights on SQL to change or run a query. Without them the editor is read-only.
Fix a query with Bryn
When a query fails, the error card shows the database message and Retry.
- Select Fix with AI. Bryn opens with a prompt to fix the query.
- Send the prompt.
- Check the new SQL in the side-by-side view.
- Select Apply to use it, or Cancel to keep yours.
Fix with AI shows only when an AI model is set up. Build a metric with Bryn
If something goes wrong
- please add valid select query. Start the query with
SELECTorWITH, and send one statement only. - No SQL tab. Ask an Admin for a role that can view SQL.