

Metrics
Let viewers switch the chart axis
Give viewers a list of fields they can put on the X axis or the Y axis of a chart.
Before you start
- Your role can edit Switch Axis. Admins, Editors and Developers can by default.
- The metric uses one of these charts: Line, Bar, Area, Combo, Scatter, Bubble, Stack, Waterfall, Stacked Area, Pie, Doughnut, Row or Horizontal Stack. Switch Y Axis also works on Time Series and does not work on Combo.
- The comparison filter is off.
Steps
-
Open the metric in the metric builder.
-
Select Appearance in the chart toolbar.
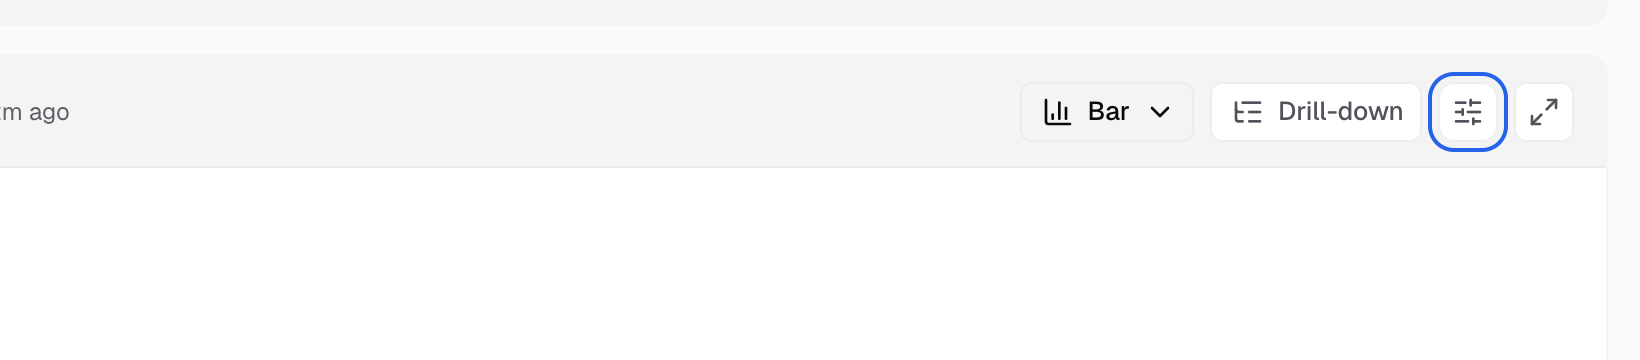
Appearance is the sliders icon at the right of the chart toolbar. -
Select the Actions tab.
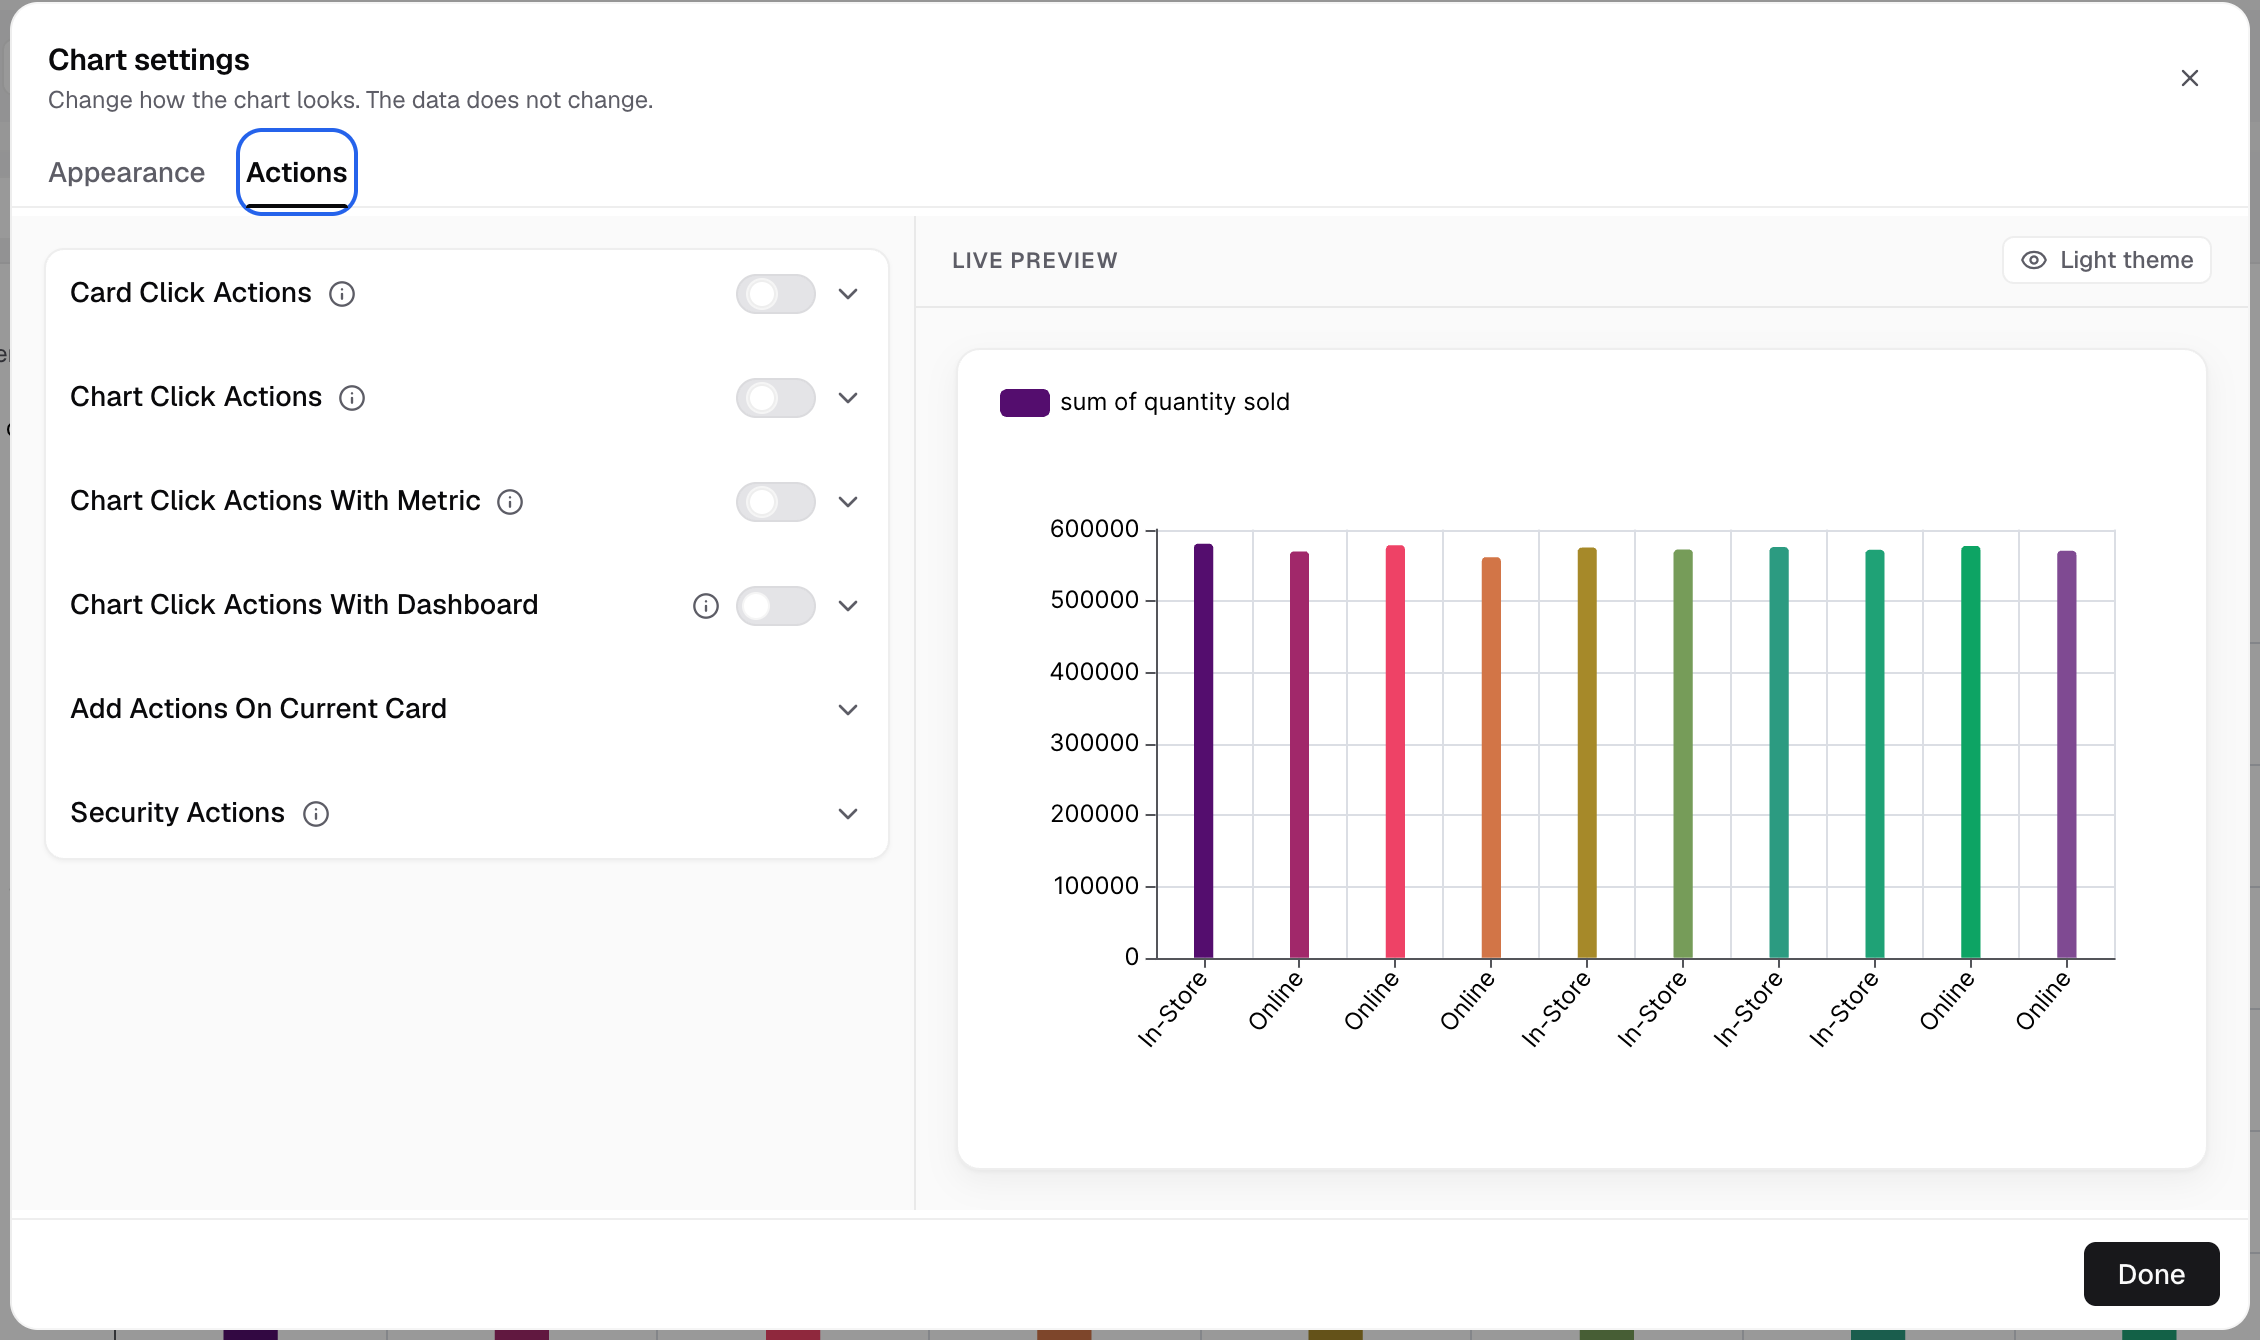
Chart settings has two tabs: Appearance and Actions. -
Open Add Actions On Current Card.
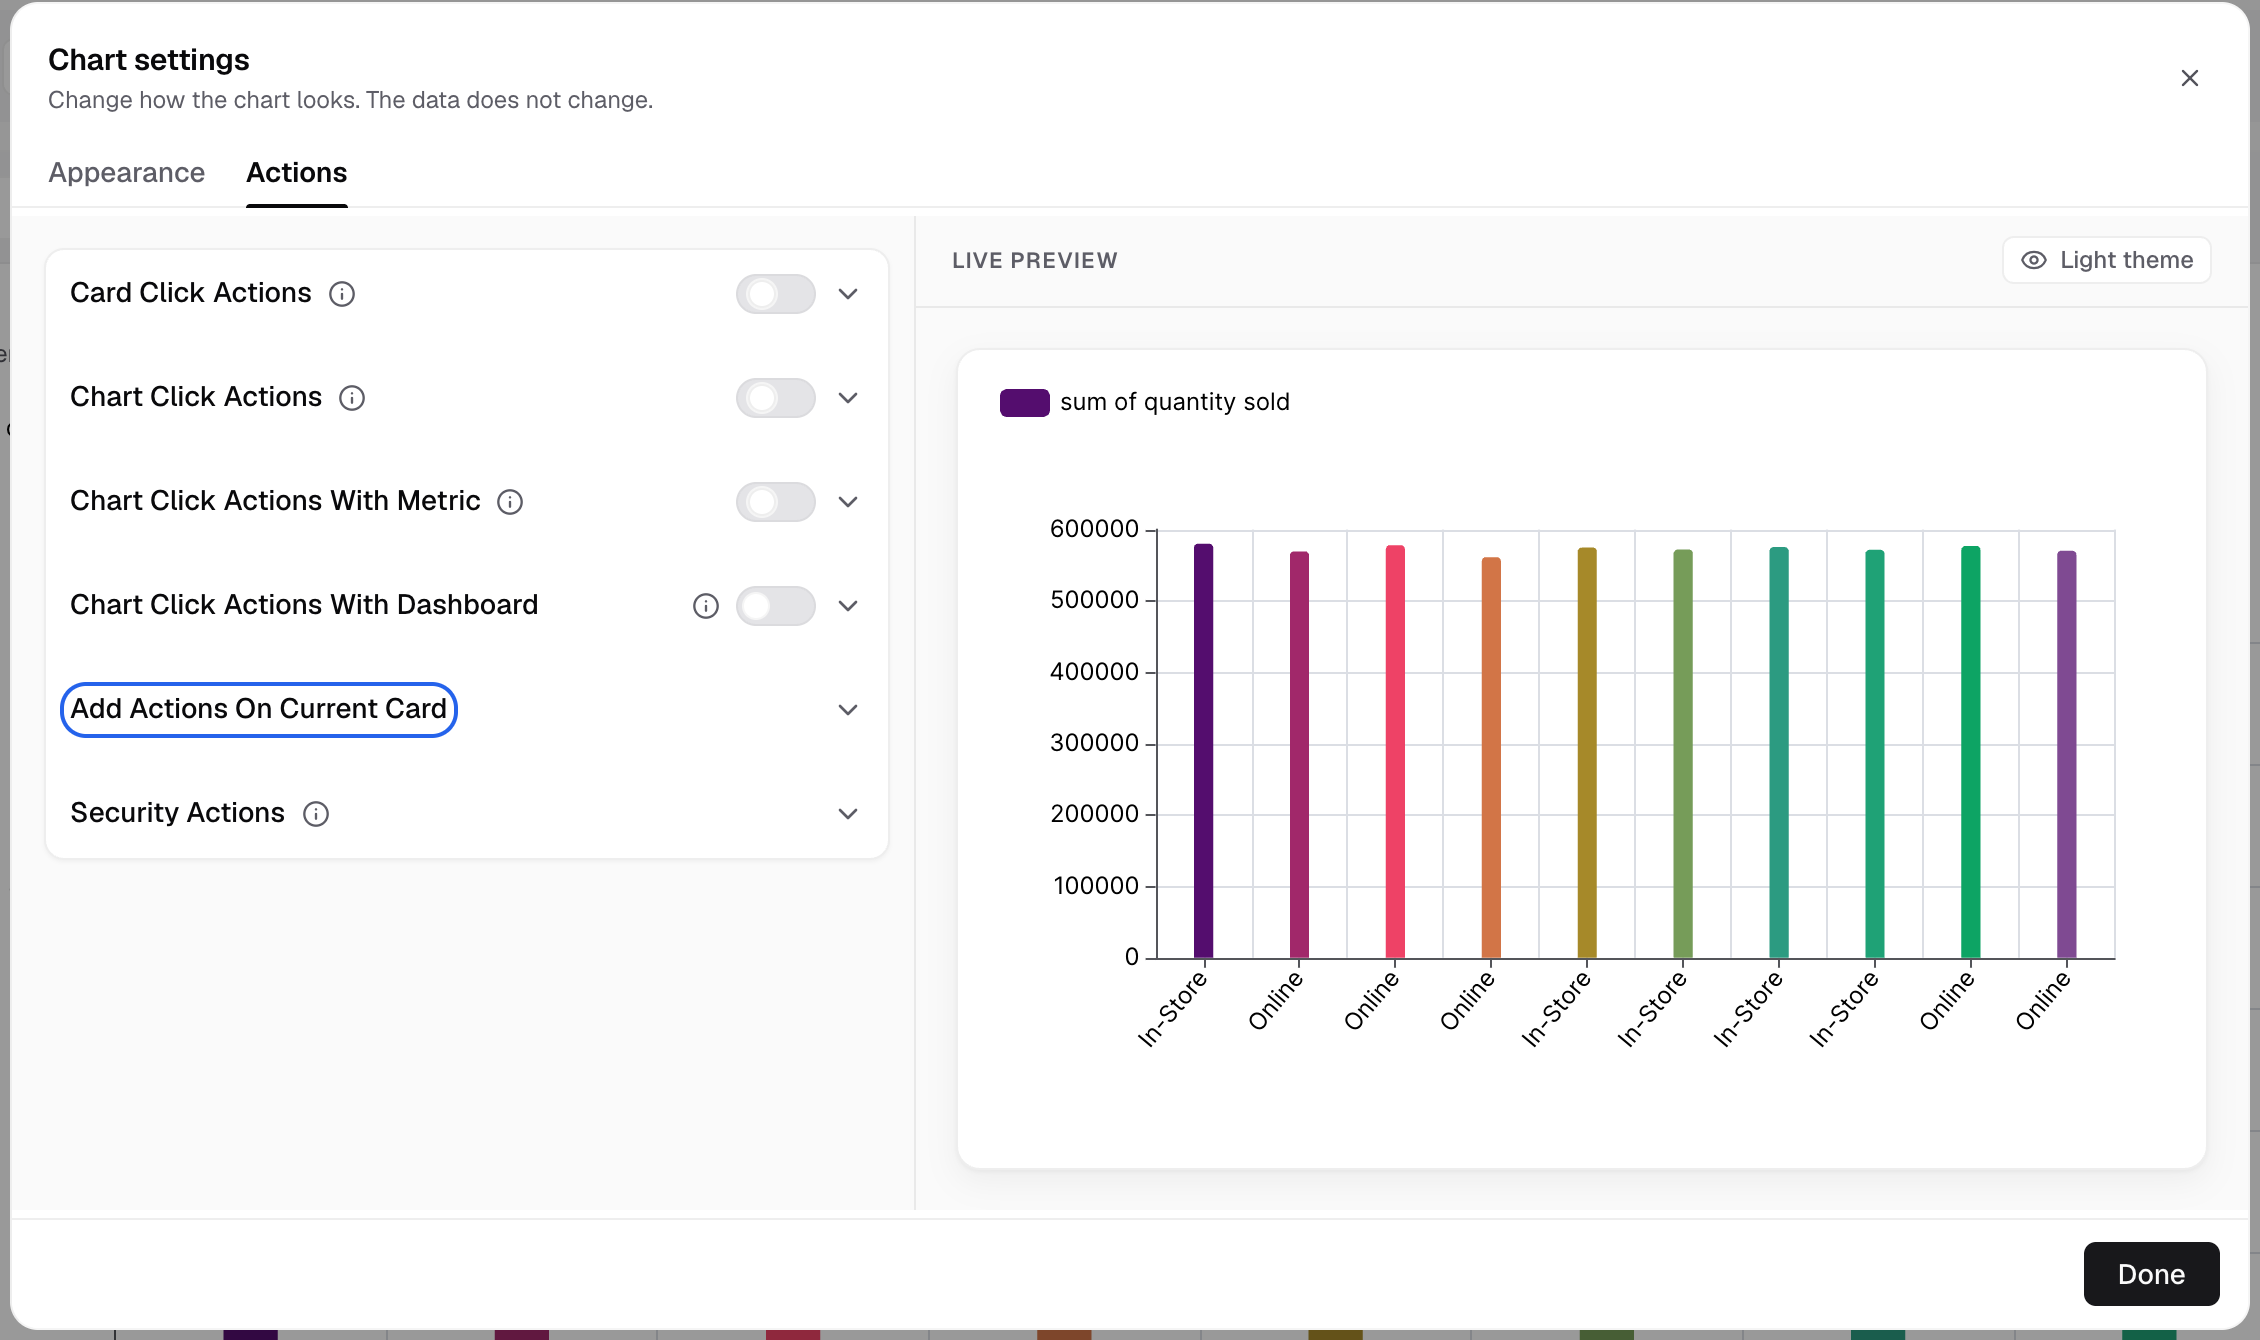
Add Actions On Current Card holds the switch axis settings. -
Turn on Switch X Axis. Each switch has the line Switch Axis under its name.
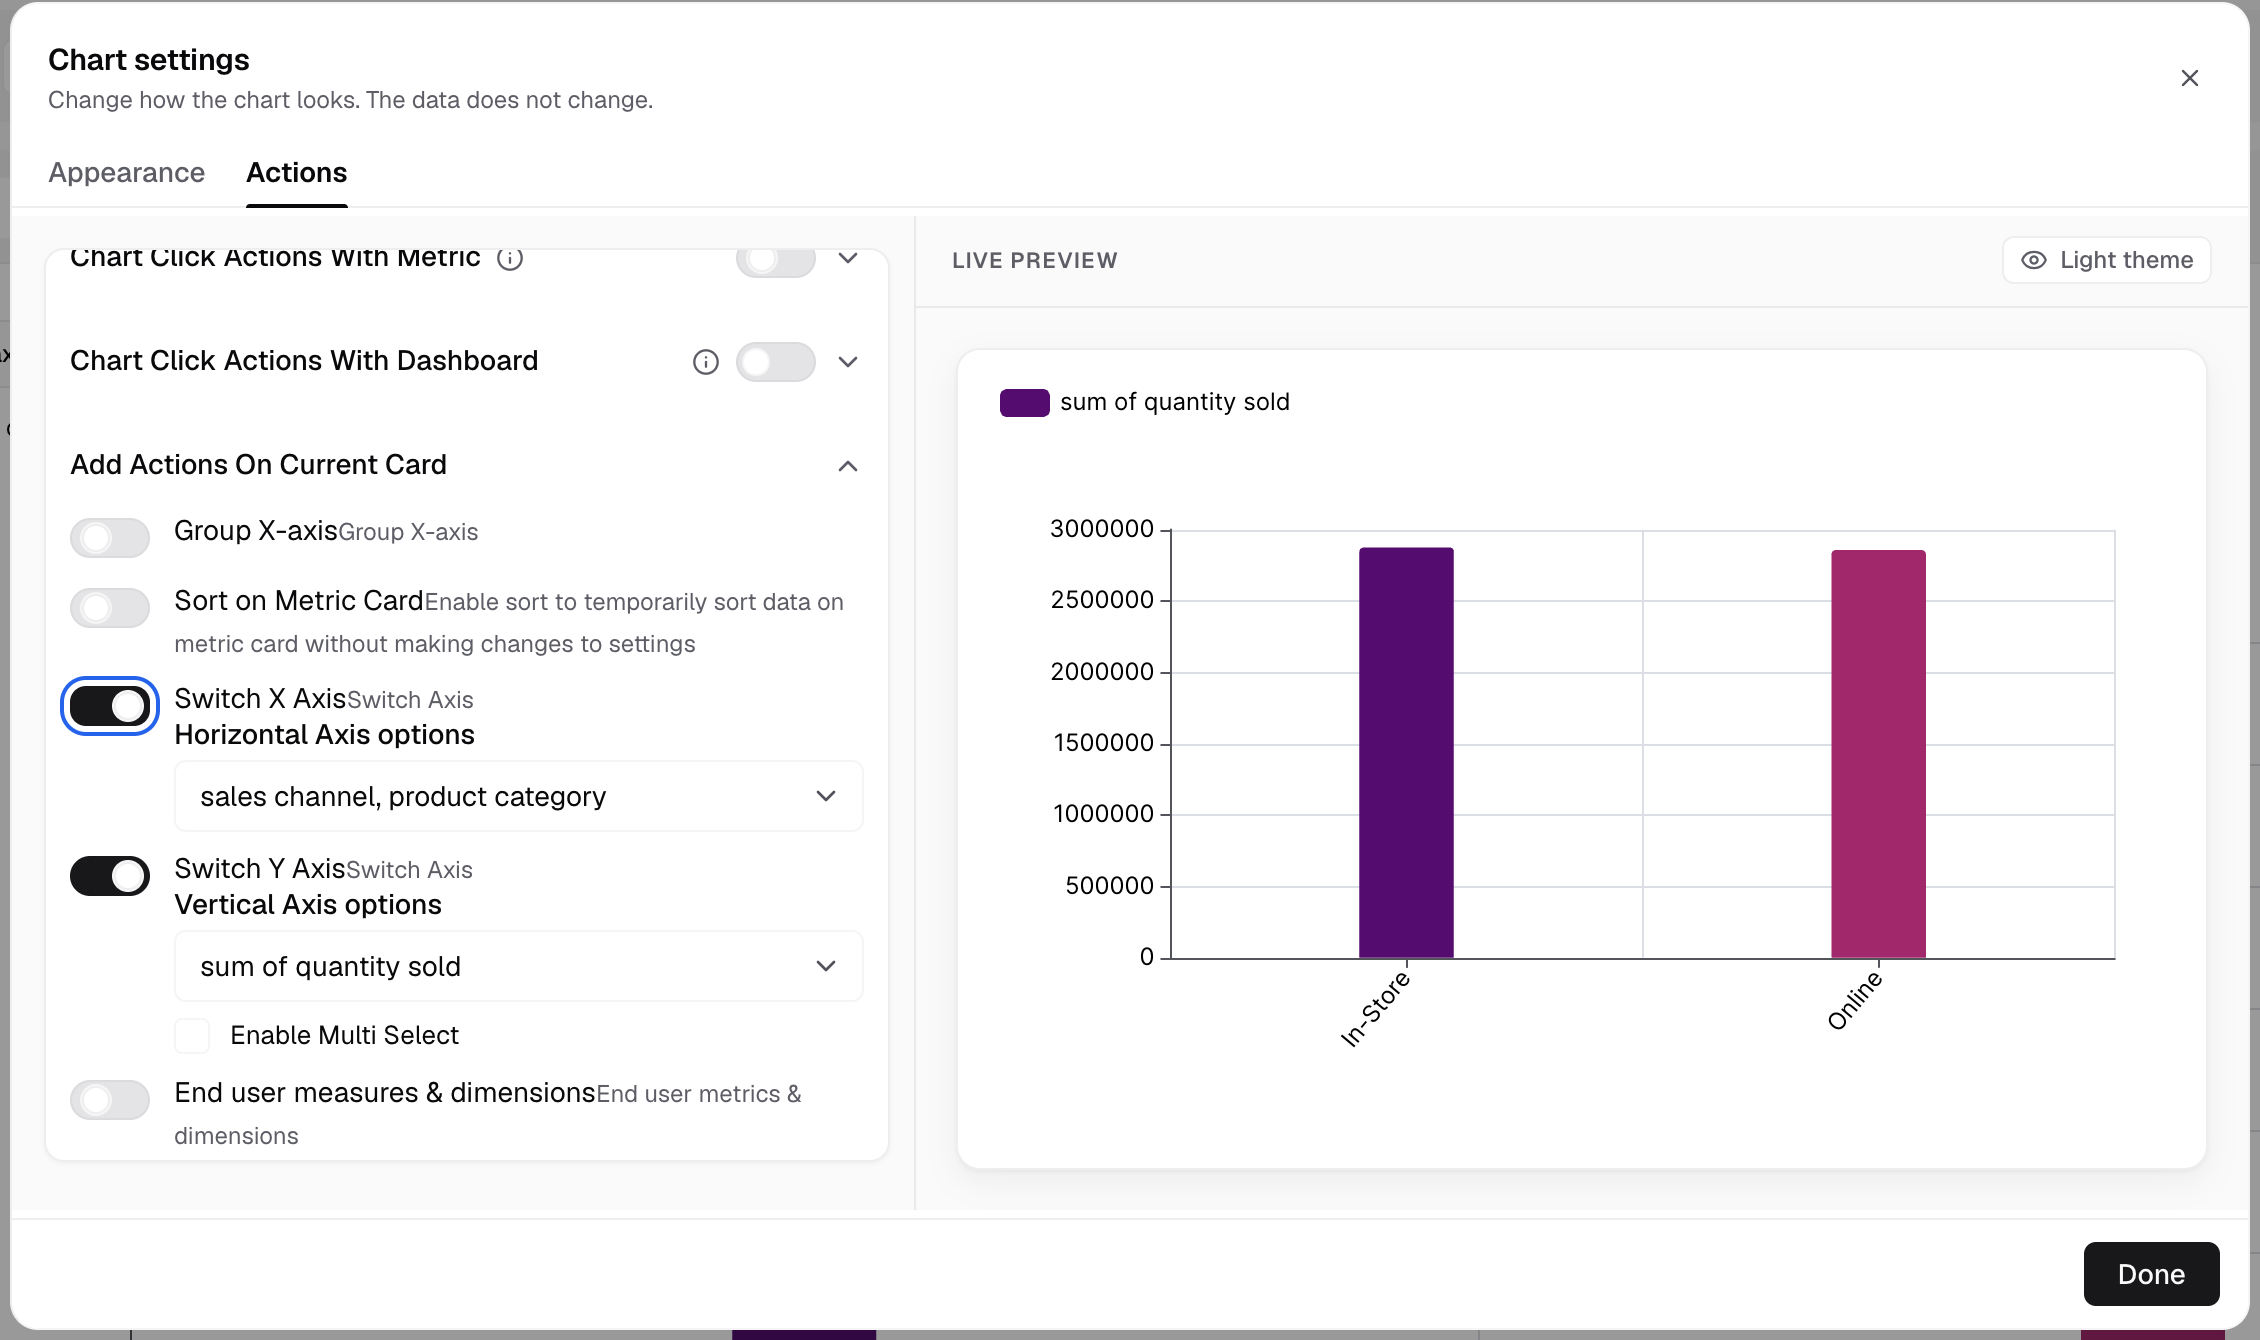
Turn on Switch X Axis. -
In Horizontal Axis options, select the dimensions viewers can pick from.
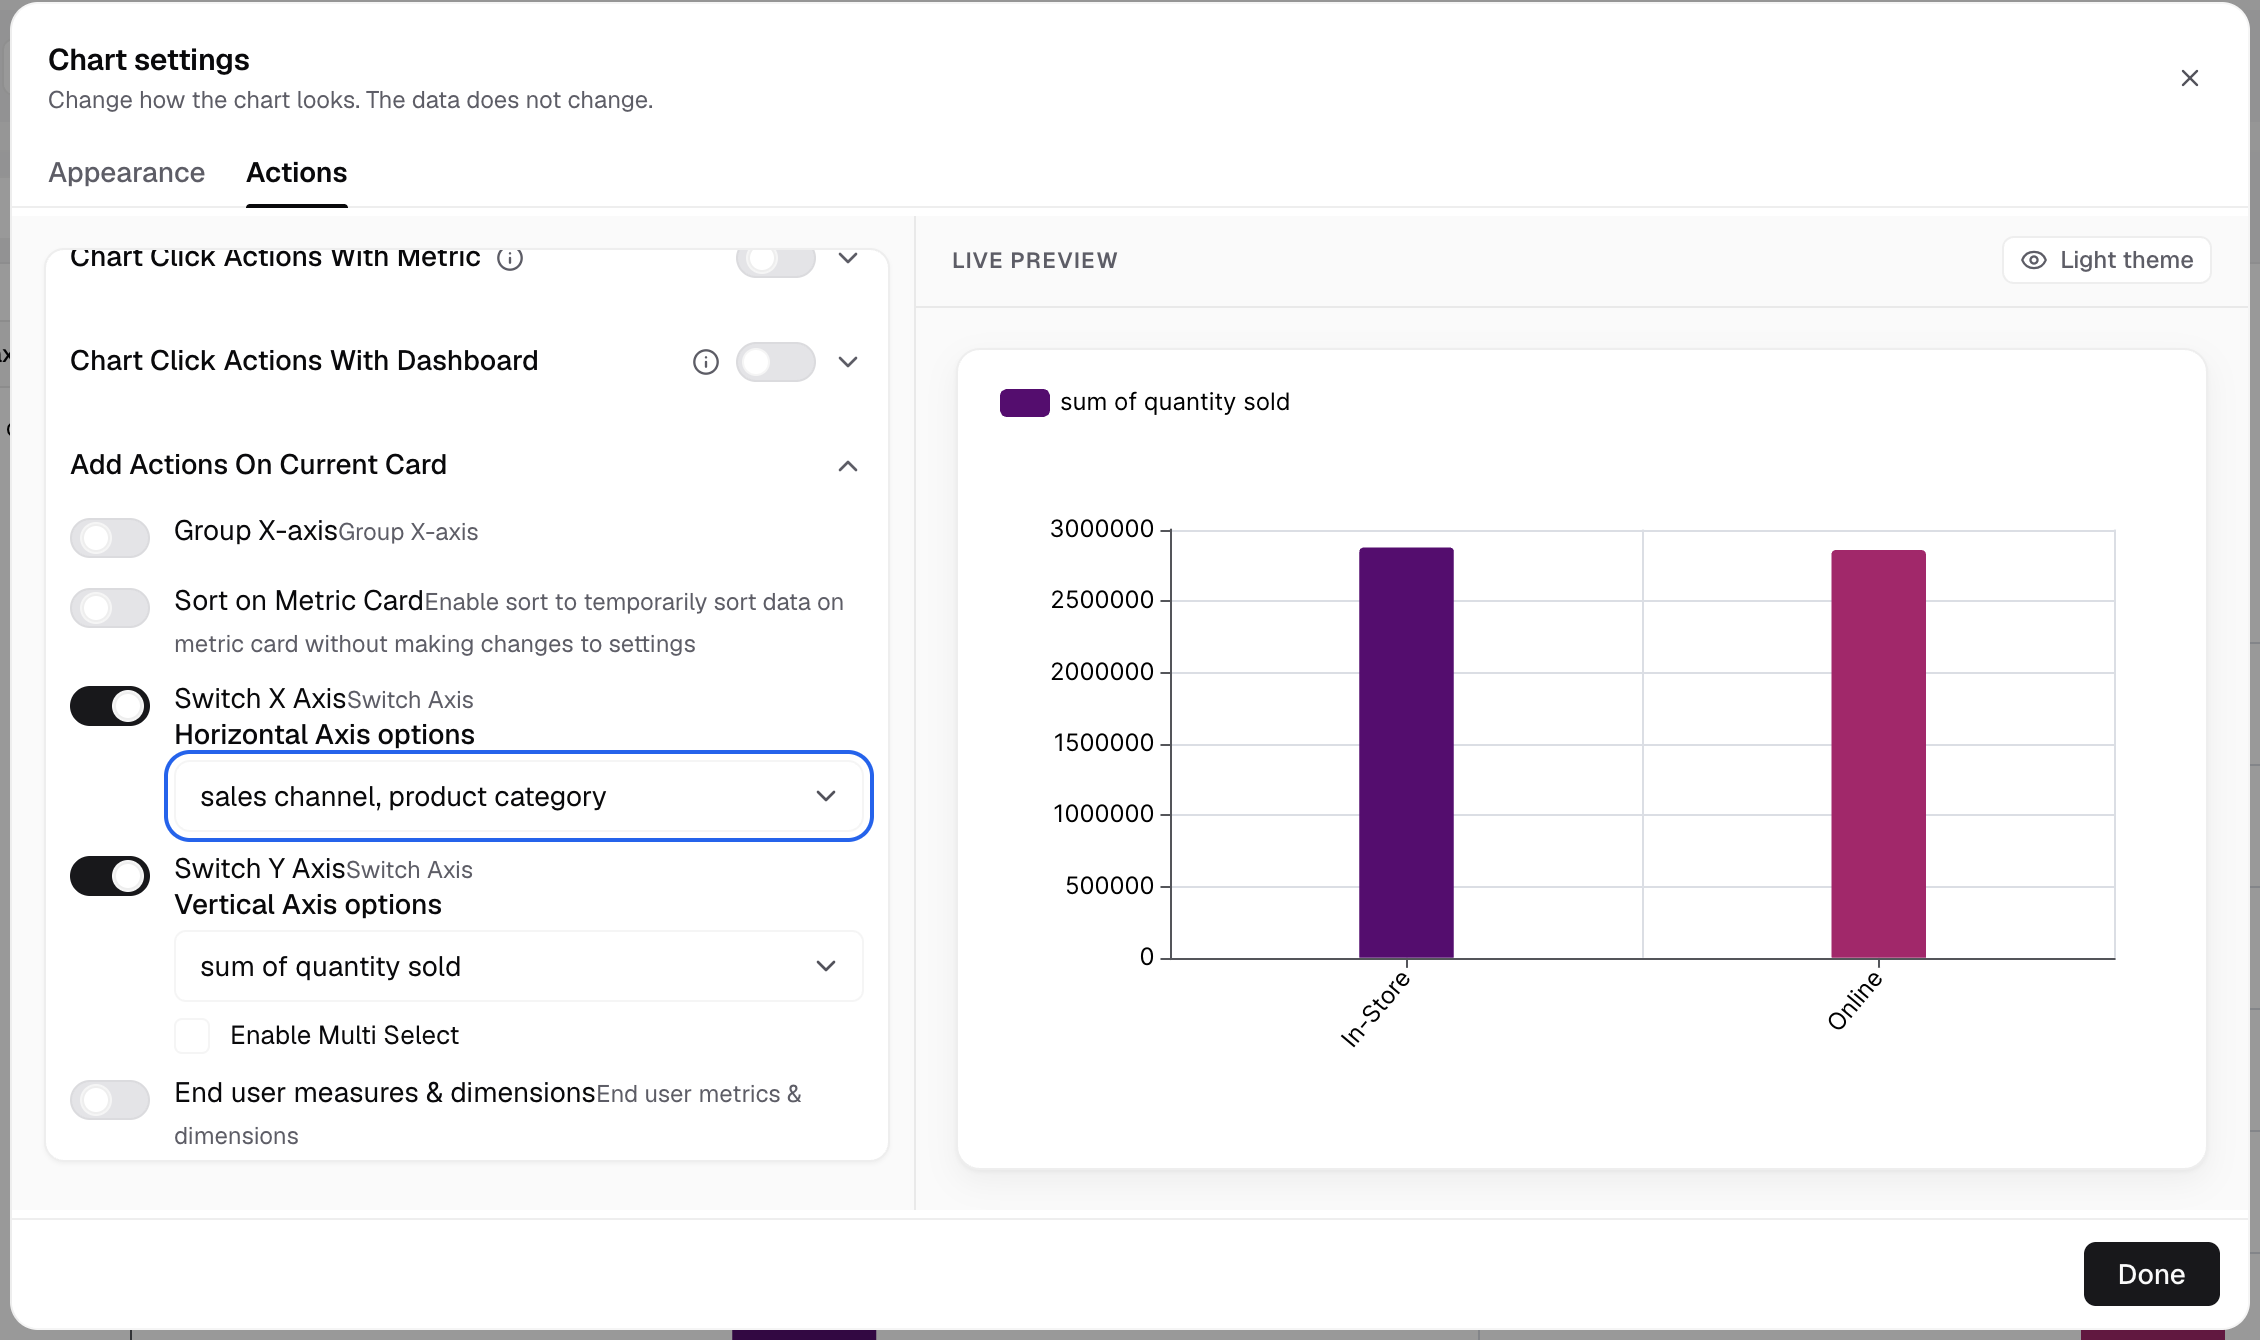
Horizontal Axis options lists the dimensions viewers can switch to. -
Optional: select Enable Custom Fields to add the table’s custom fields to the list.
-
Turn on Switch Y Axis.
-
In Vertical Axis options, select the measures viewers can pick from.
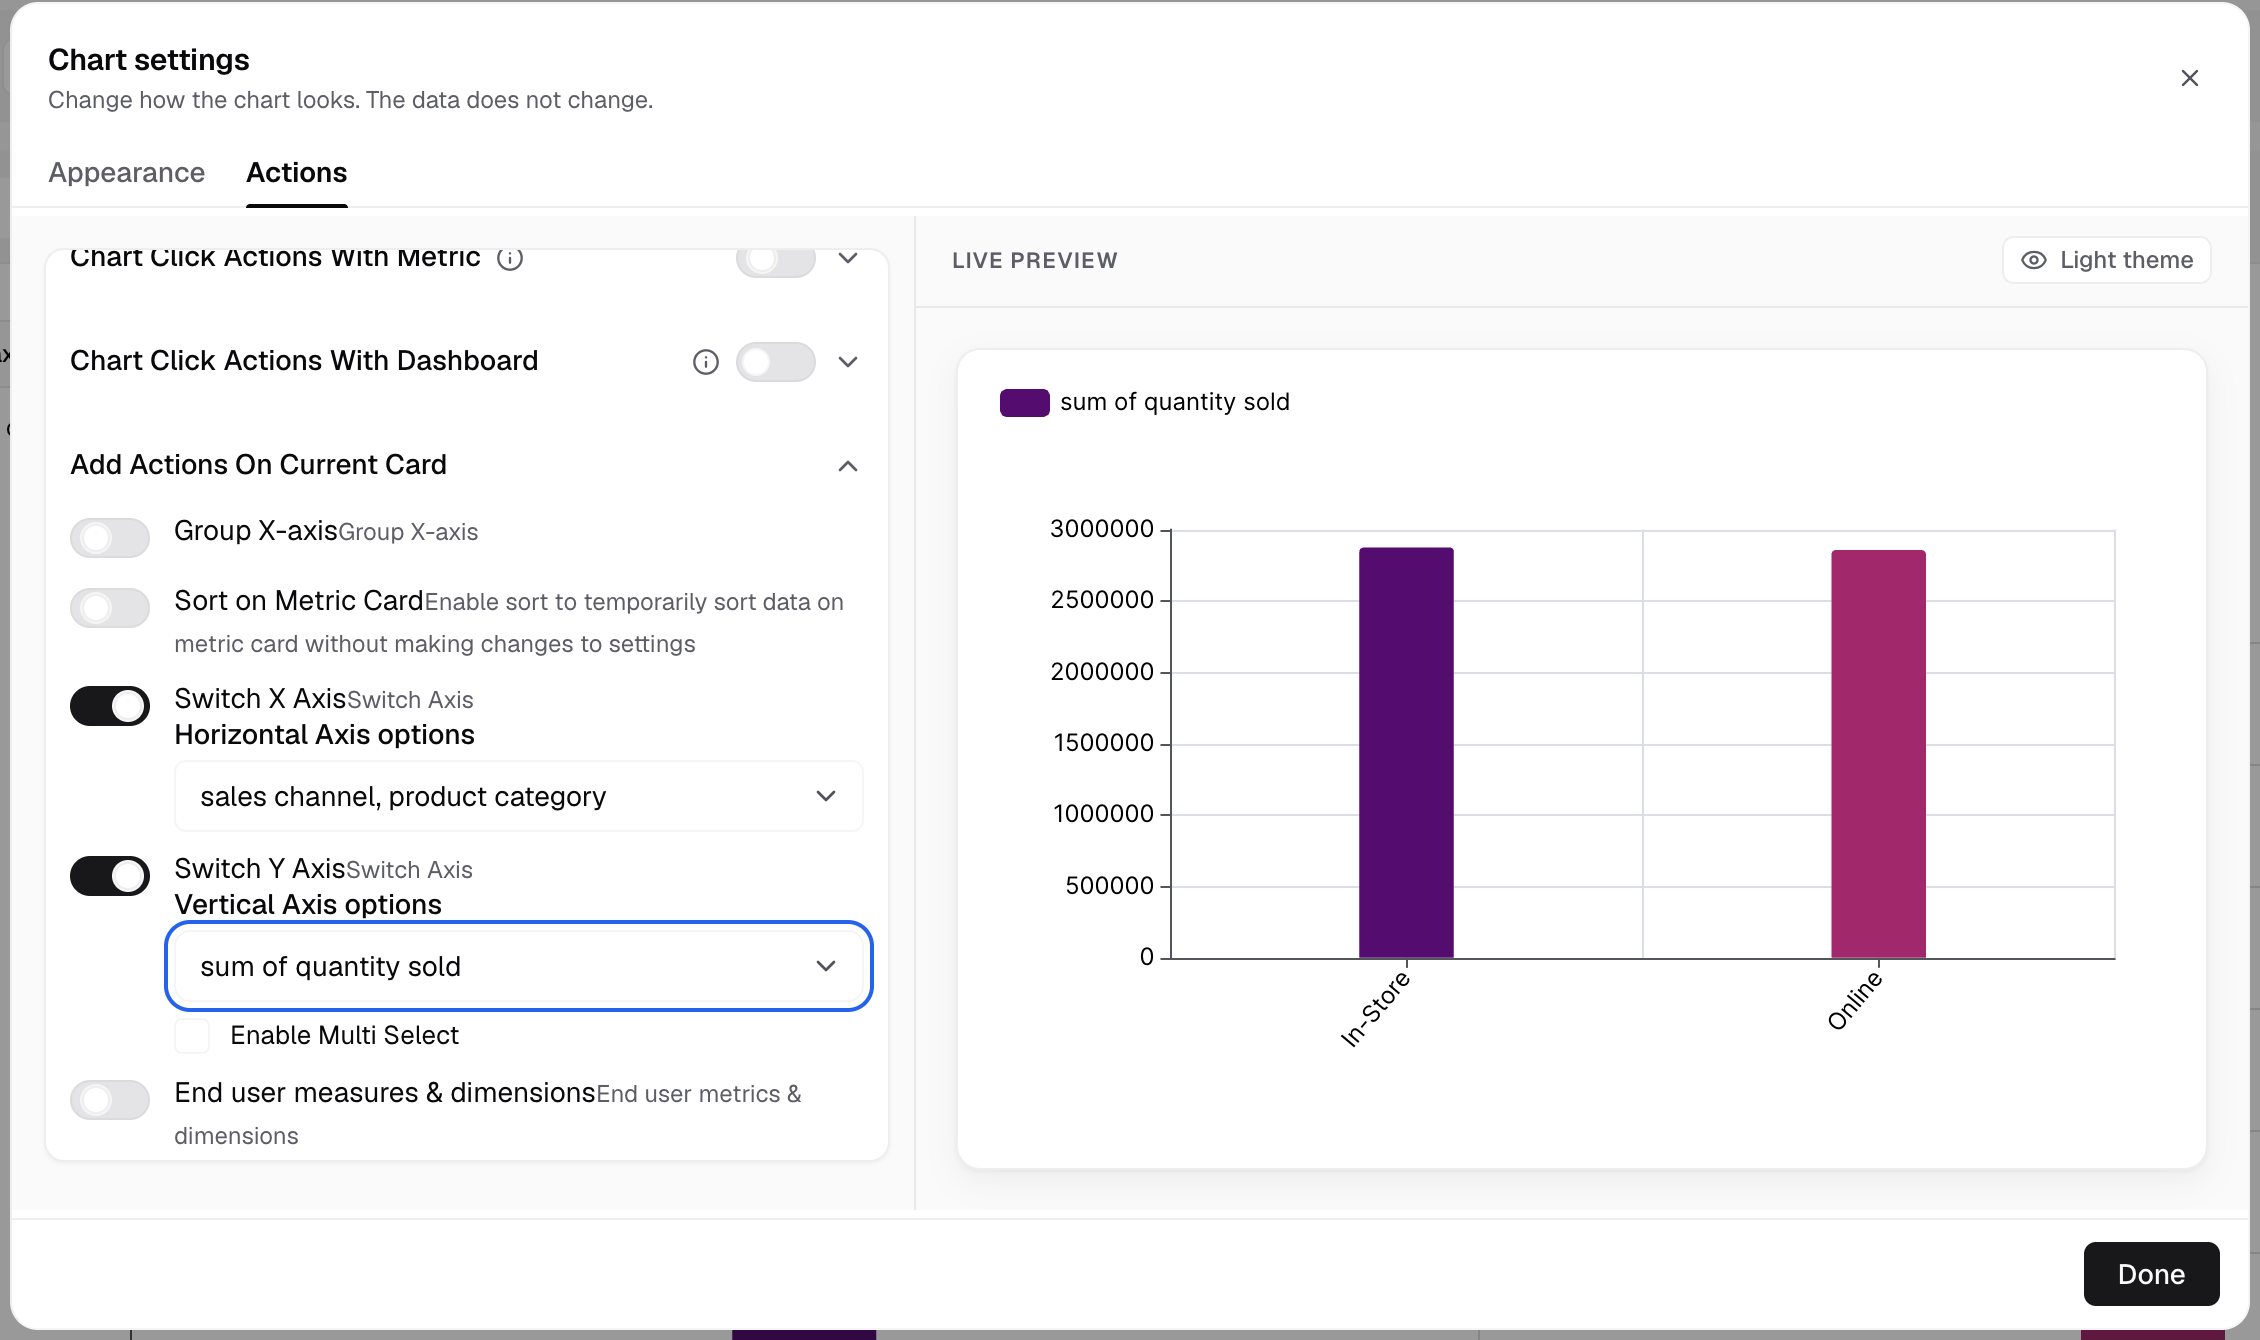
Vertical Axis options lists the measures viewers can switch to. -
Optional: select Enable Multi Select so viewers can show more than one measure at a time.
-
Wait for Saved in the header. The builder saves chart settings on its own.
The chart now shows the axis lists. The first field you selected is the default.
A faster way: select Add filter above the chart, then Switch X Axis or Switch Y Axis. This turns the switch on with every field in the list. Change the list in the Actions tab.
On horizontal charts, such as a horizontal bar, Row and Horizontal Stack, the labels swap. Switch Y Axis changes the dimension, with Vertical Axis options. Switch X Axis changes the measure, with Horizontal Axis options.
If something goes wrong
- Switch X Axis is greyed out in the Add filter menu. It is already on. Change it in the Actions tab.
- Enable Custom Fields is not shown. The metric’s main table has no custom fields.
- The Actions tab is greyed out. The chart is Gauge V2, Linear Gauge V2, Progress Bar V2 or Gantt, or the metric is a dynamic table from SQL.