

Metrics
Join, filter, sort and group a metric
Use the Query toolbar to pull in other tables, keep only some rows, order them and roll them up.
Use the Query toolbar to pull in other tables, keep only some rows, order them and roll them up.
Before you start
- The metric is open in the builder on the Schema tab. Create a metric
- The metric has at least one field in Dimensions or Measures. The toolbar buttons stay off until then.

Join a table
-
Select Join.

Join is the first button in the Query toolbar. -
Select Add join.
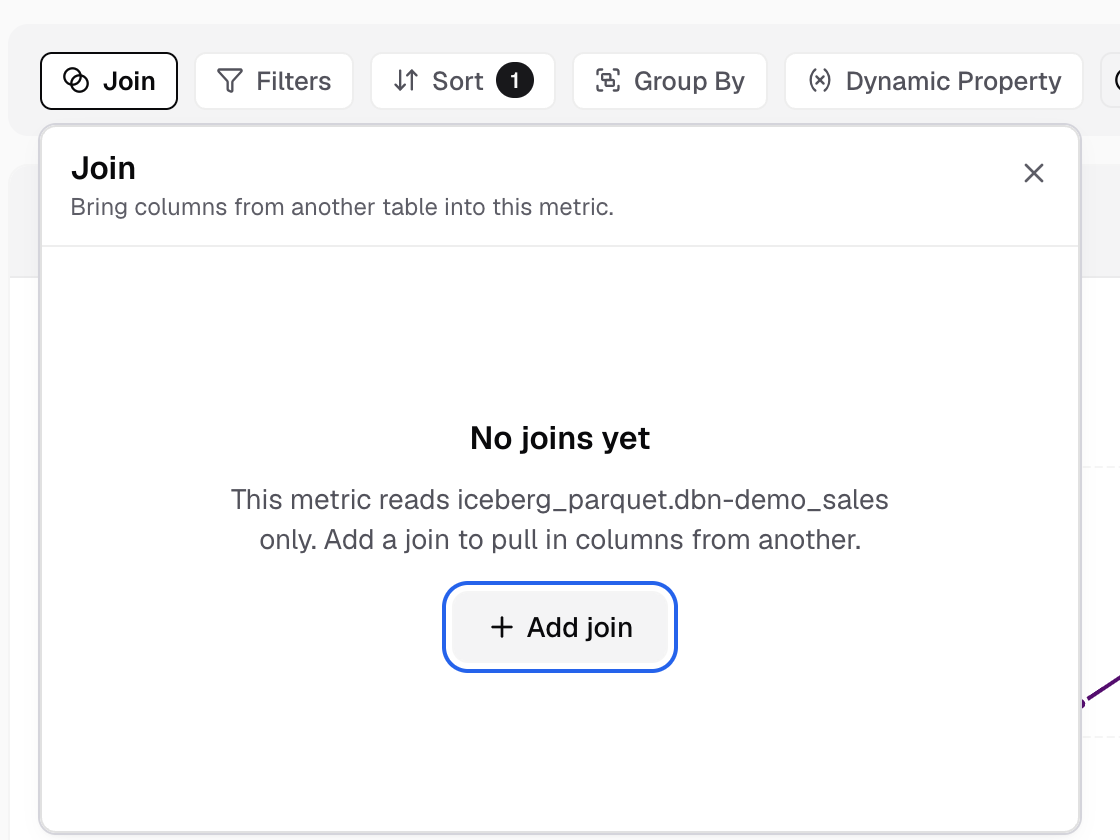
With no joins yet, the Join panel shows Add join. -
In Secondary Table, pick the table to join.
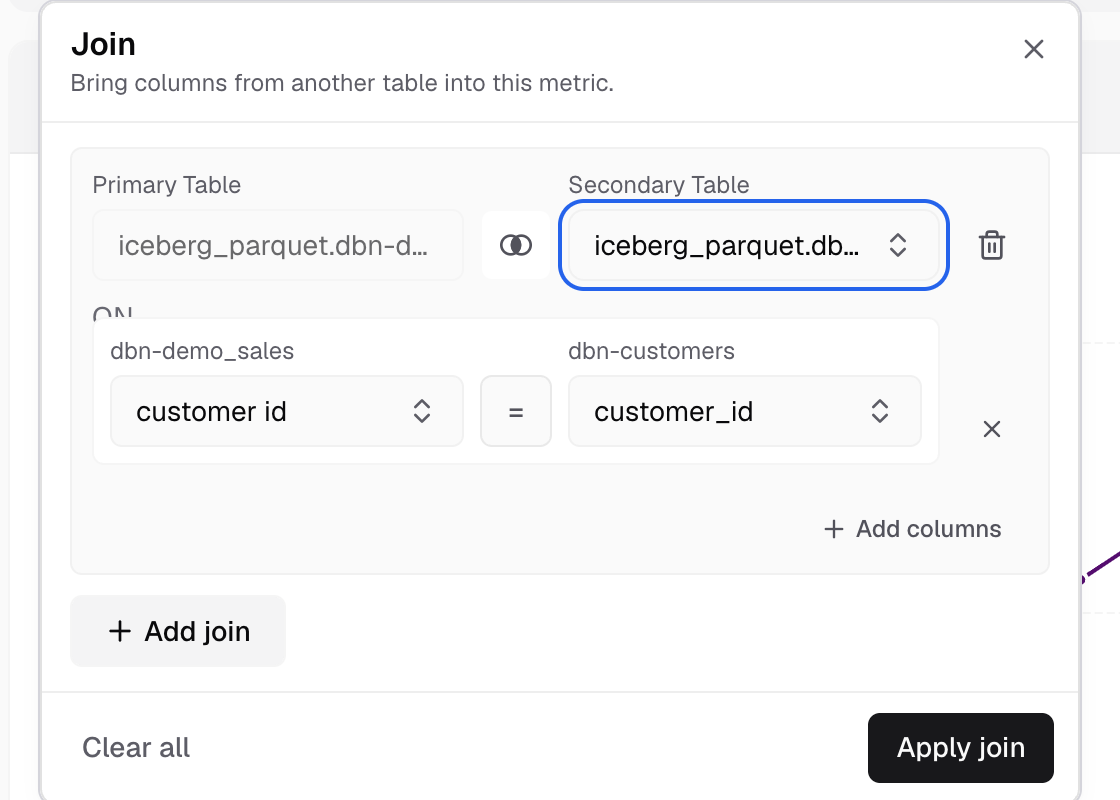
The primary table is fixed; pick the Secondary Table. -
Select the join type icon and choose Inner Join, Left Join, Right Join or Full Join.
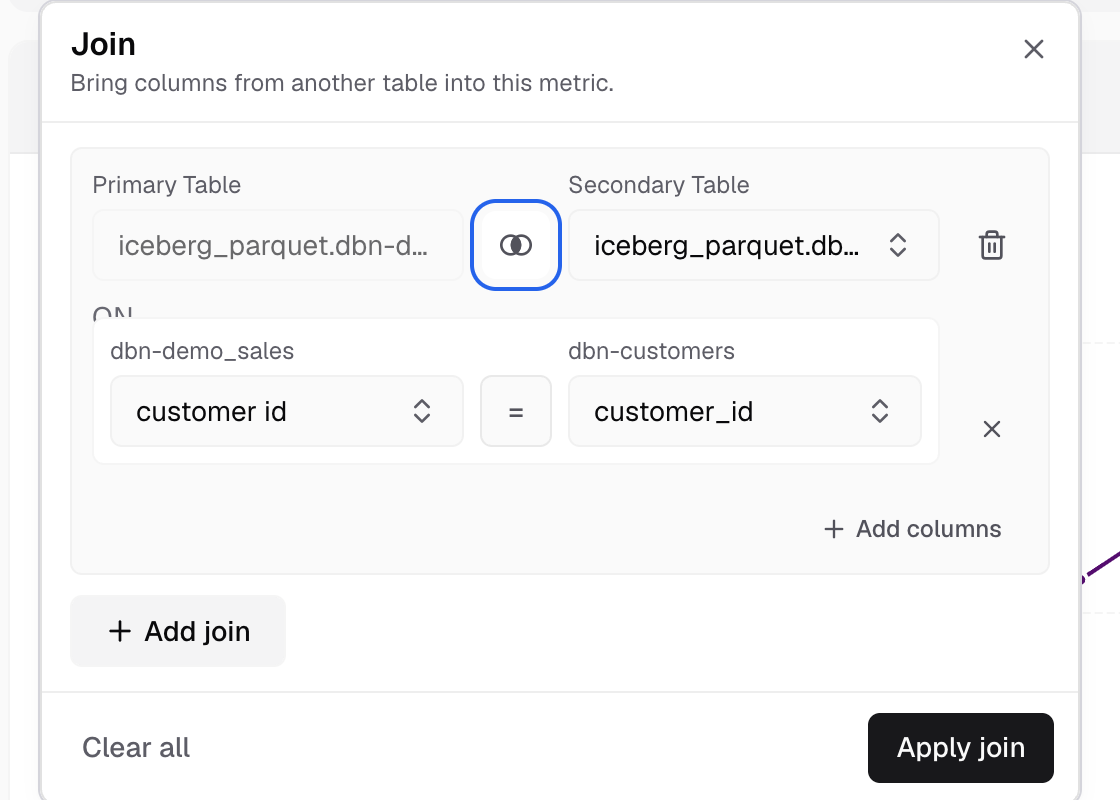
The join type icon sits between the two tables. -
Pick a column from each table, for example
orders.customer_idandcustomers.id.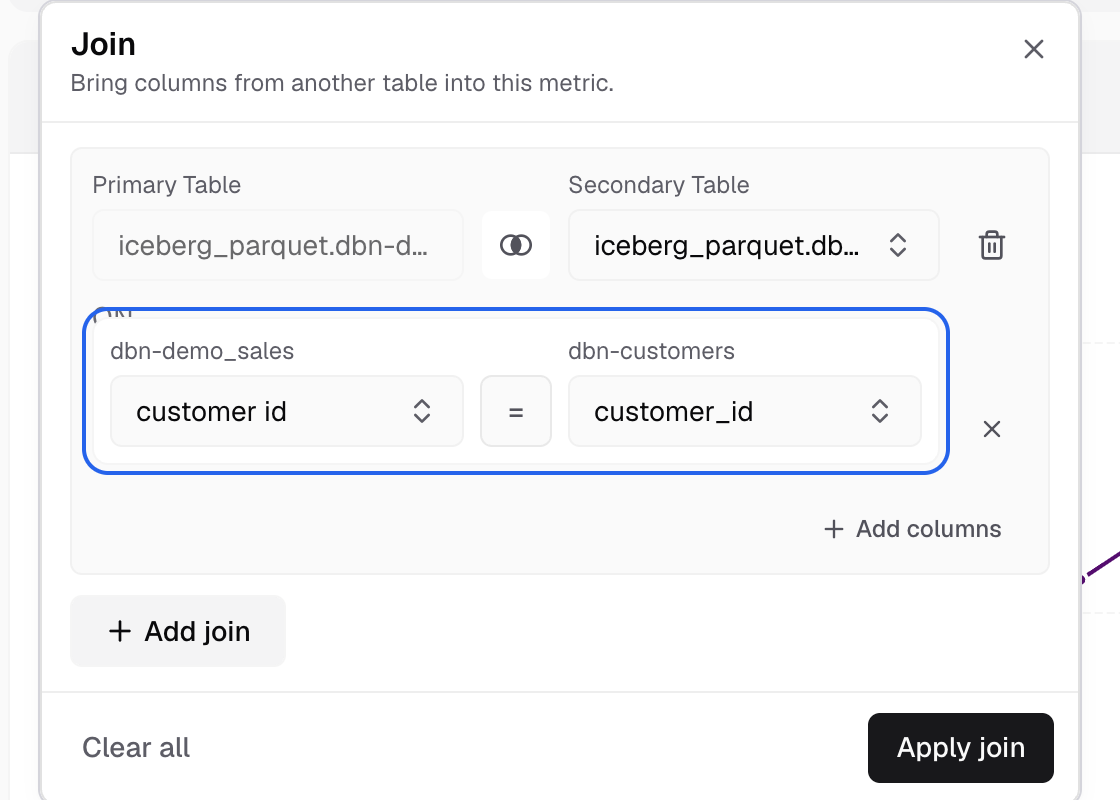
Under ON, pick the matching column of each table. -
Keep the operator Equal to (=), or pick another one.
-
Select Apply join.
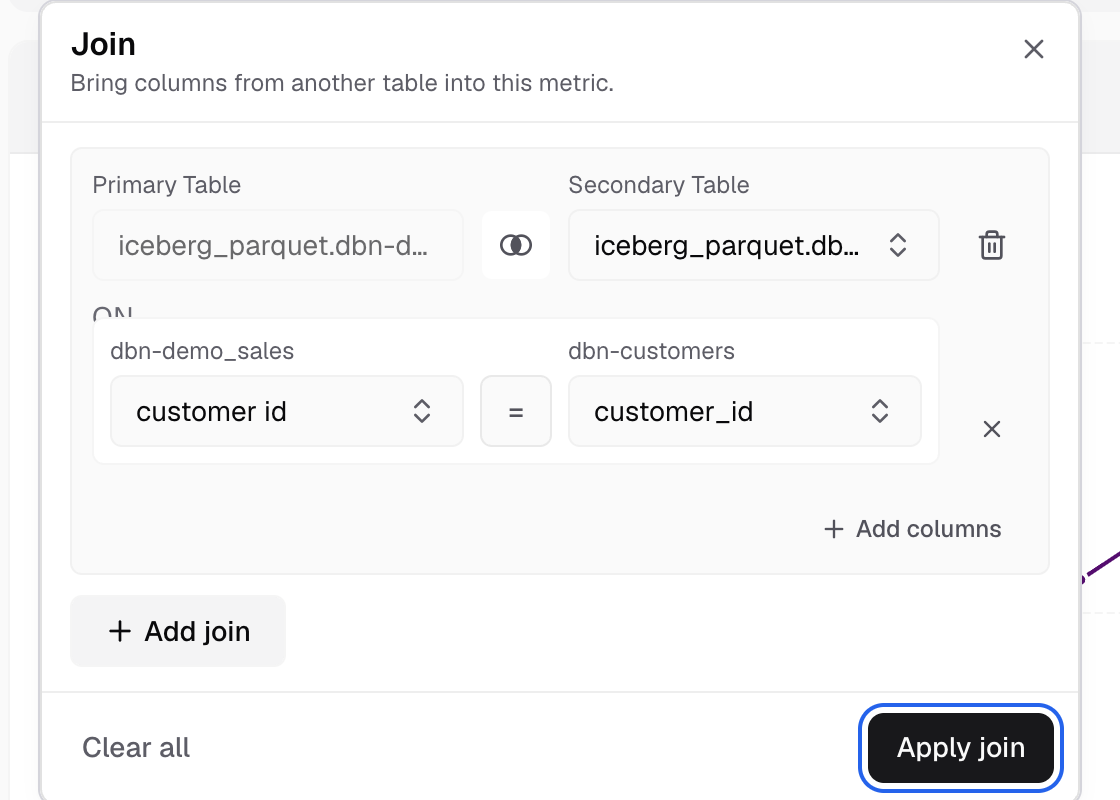
Apply join is at the bottom right of the panel.
You can now add columns from the joined table. To join on more than one pair, select Add columns. A second join starts from Previous Join Data.
Joins are not available on the SQL tab, in Python mode, or on Elasticsearch and OpenSearch.
Filter rows
-
Select Filters.
-
Select Add Filter, then Simple Filter.
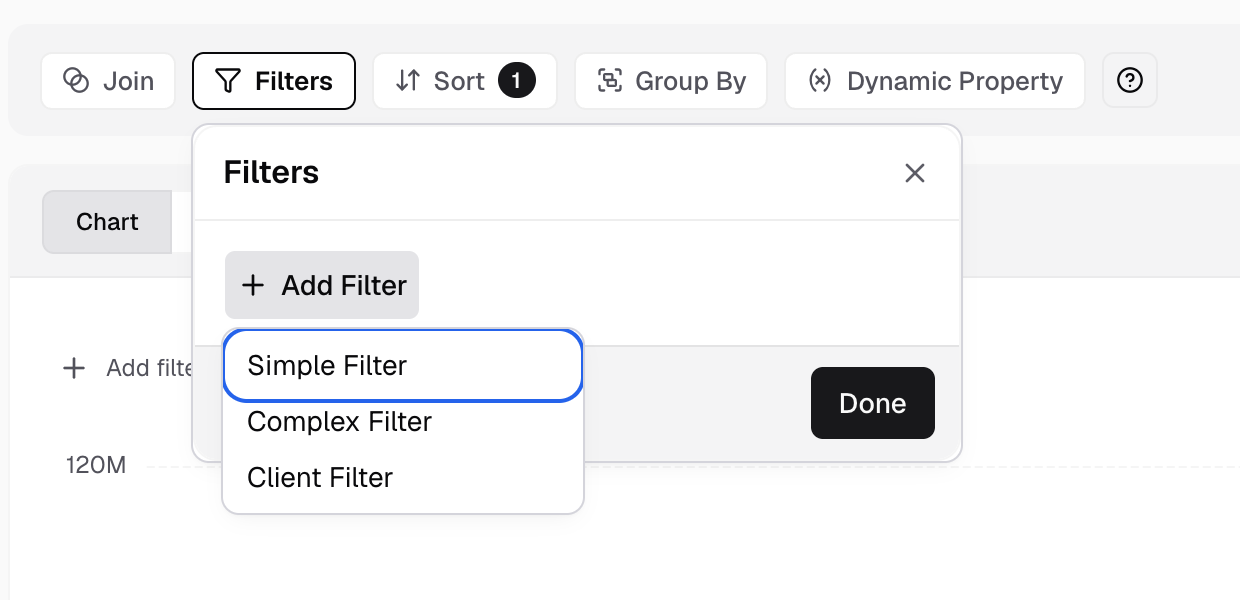
Add Filter offers Simple Filter, Complex Filter and Client Filter. -
In Select a column, pick a column, for example
status.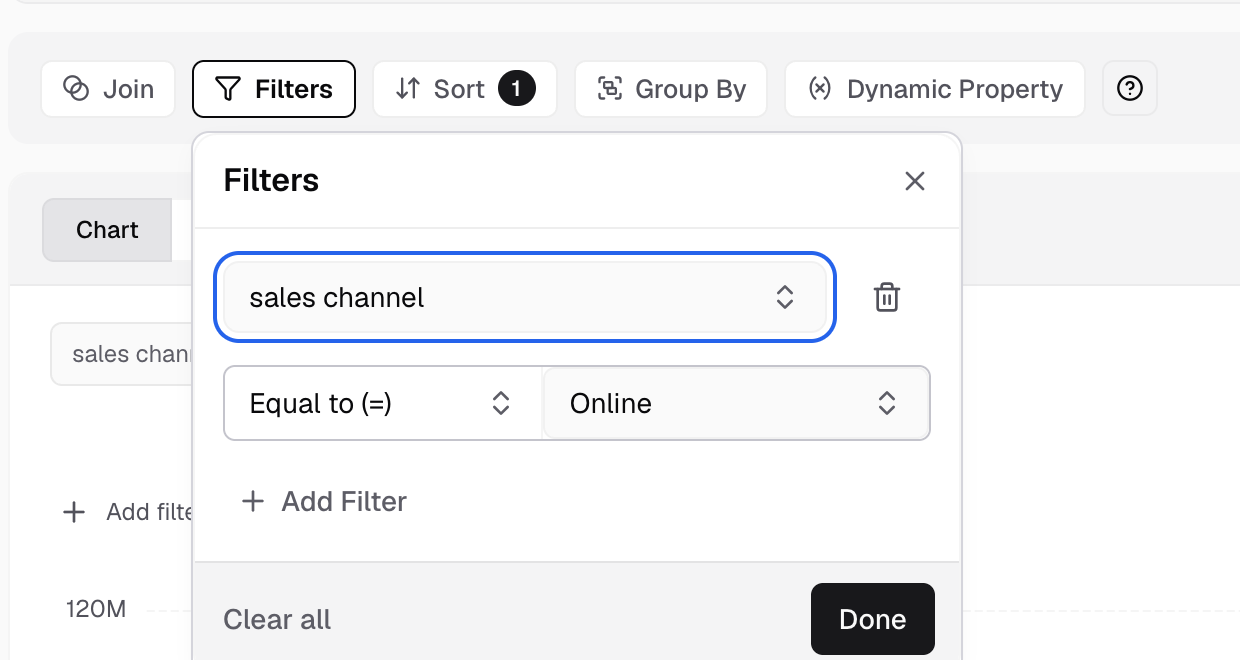
Pick the column the filter checks. -
Pick an operator, for example Equal to (=).
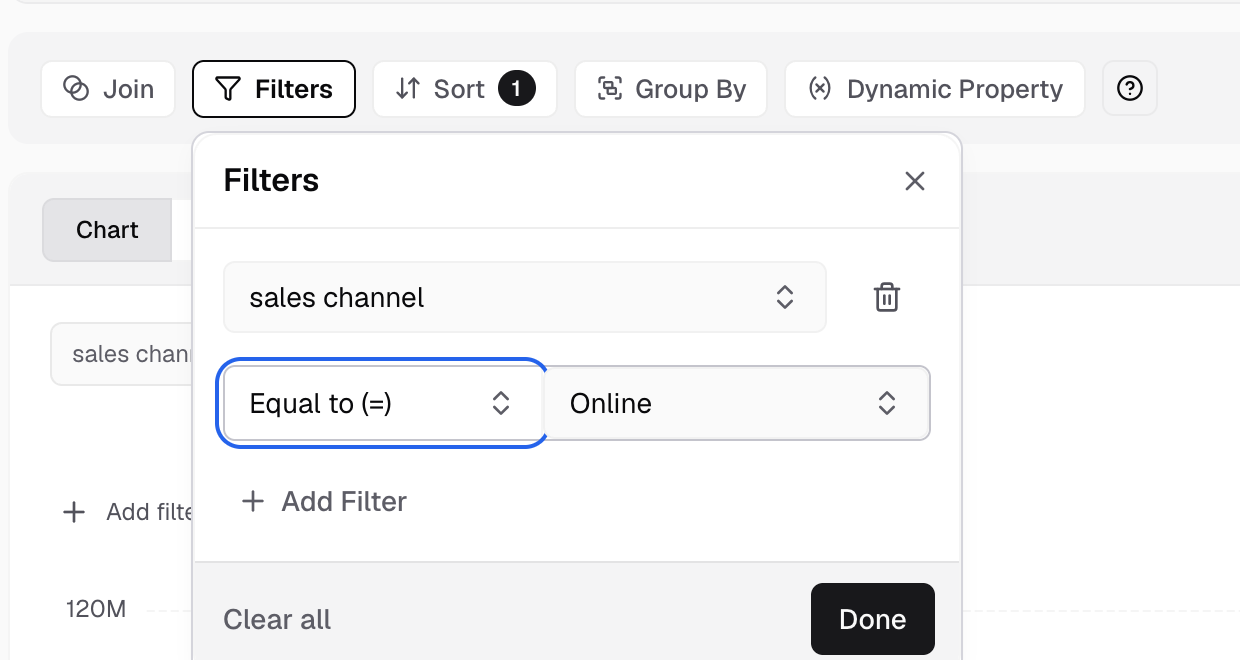
The operator is under the column. -
Enter or pick the value, for example
paid.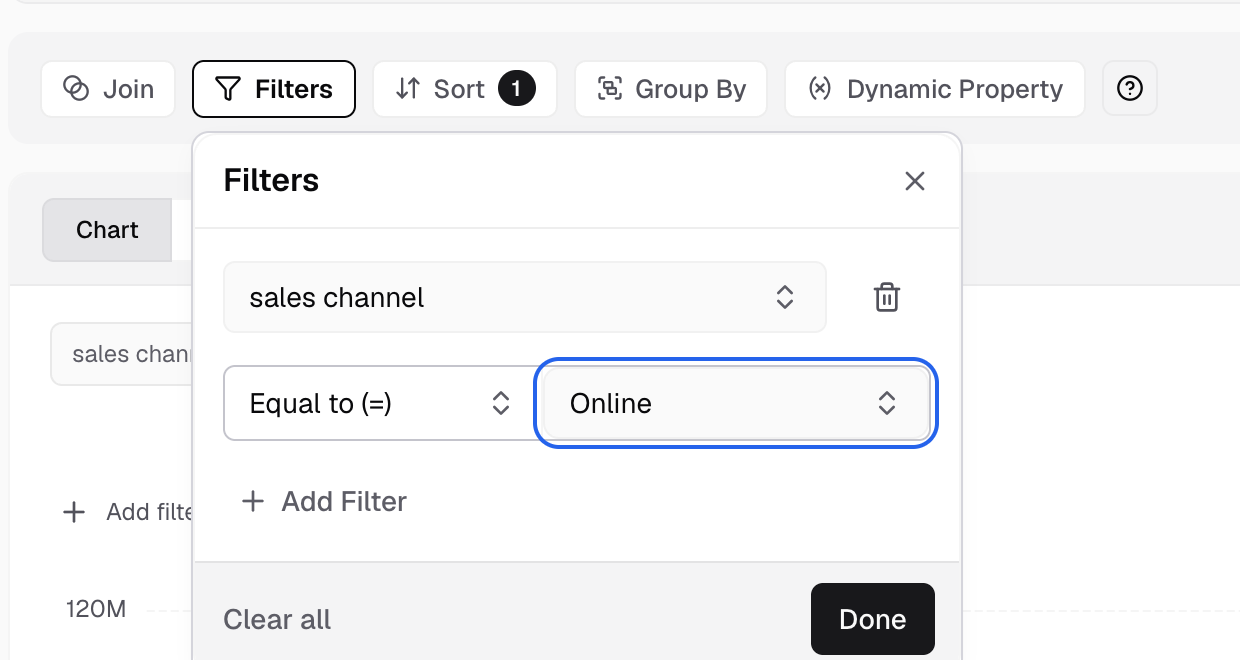
Pick or type the value next to the operator. -
Select Done.
To add another filter, finish the current one first. Then choose AND or OR in Join with previous filter.
| Column type | Operators |
|---|---|
| Text | Equal to (=), Not equal to (!=), In, Not in, Like (case sensitive), Is not null, Is null |
| Number | Equal to (=), Not equal to (!=), Less than (<), Less or equal (<=), Greater than (>), Greater or equal (>=), In, Not in, Is not null, Is null |
| Date | The number operators, and Between |
For a date, pick a preset such as Last Year, or pick dates with Select Date or Select Range.
The Add Filter menu also has Complex Filter, for a SQL condition, and Client Filter. Add a complex filter
Sort rows
-
Select Sort.
-
Select Add Sort, then Simple Sort.
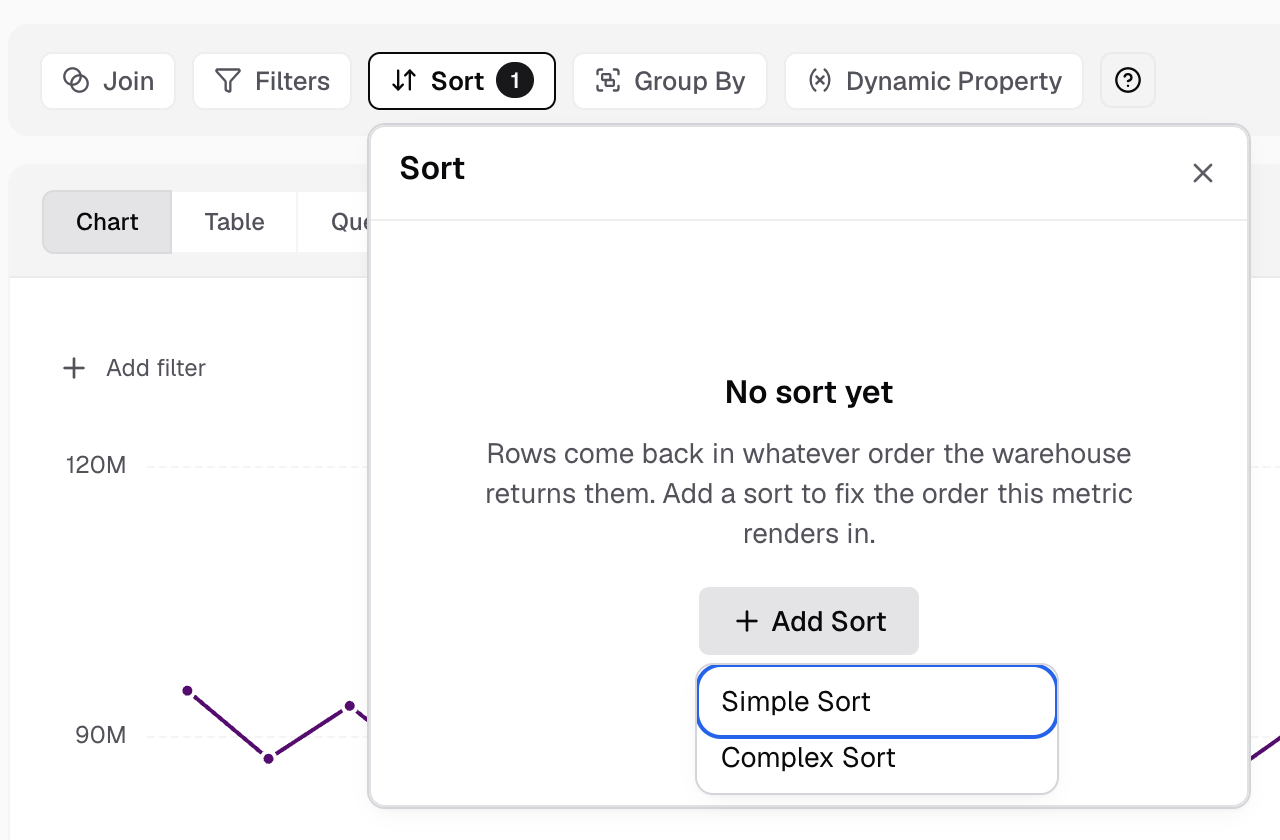
Add Sort offers Simple Sort and Complex Sort. -
Pick the column.
-
Choose Ascending or Descending.
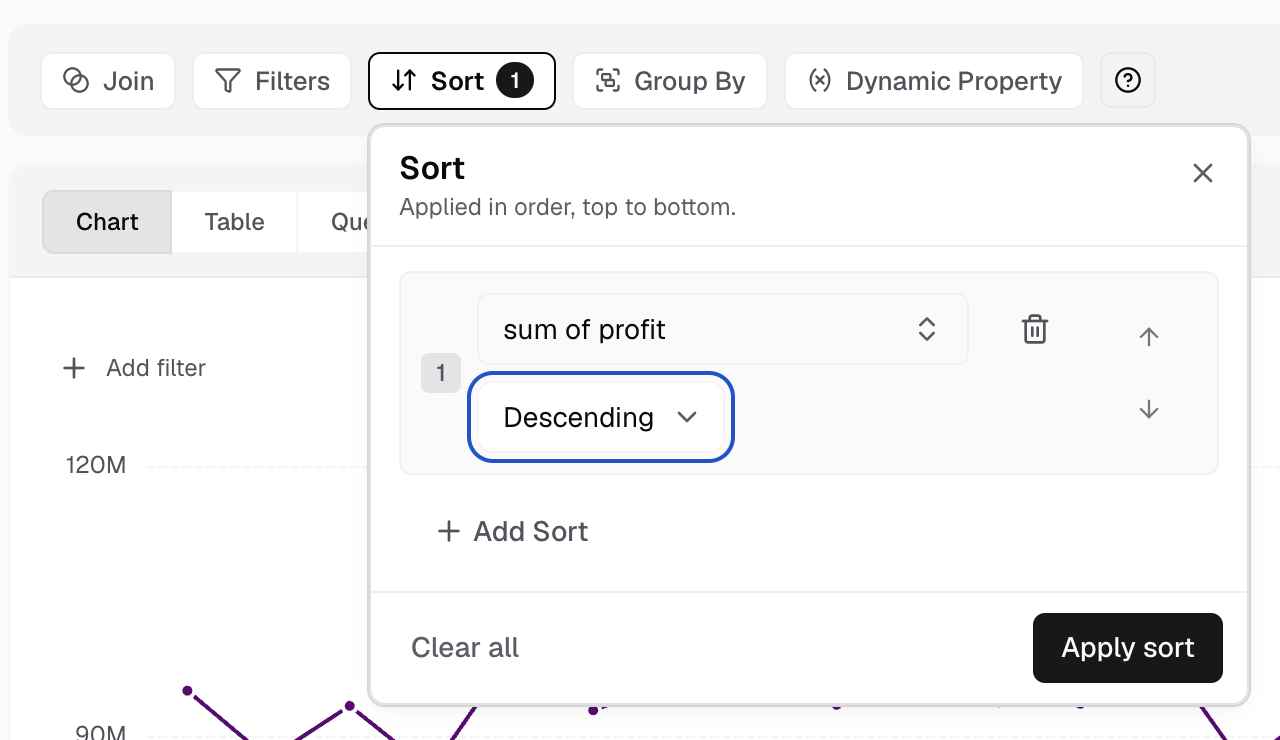
Set the order under the column. -
Select Apply sort.
Sorts apply in order, top to bottom. Use the arrows to move a sort earlier or later. To sort by a SQL expression, choose Complex Sort, fill in Sort expression and Sort name, and select Add.
Group rows
-
Select Group By.
-
Select the dimension columns to roll the rows up by.
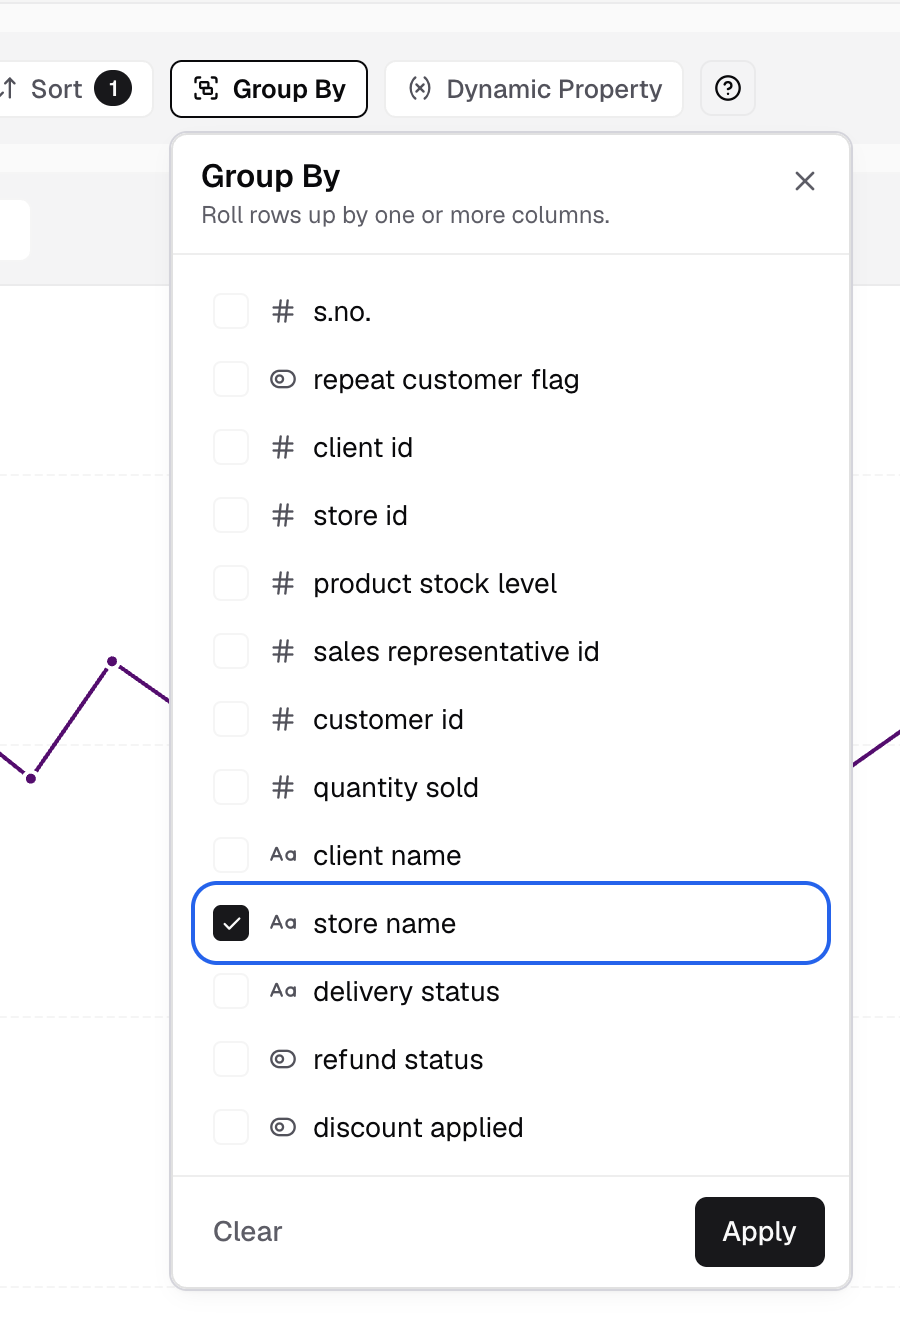
Tick the columns to roll up by. -
Select Apply.
This Group By changes the query. The Group By item in Add filter above the chart is different: it lets viewers switch the series. Group By on the chart
If something goes wrong
- Joins will be enabled after dragging and dropping a column. Add a field to Dimensions or Measures first.
- No groupable columns. Add a column to Dimensions, then open Group By again.
- You don’t have permission to add joins. Ask an Admin for the Editor role.