

Metrics
Download underlying data
See the rows behind a metric card and download them as a CSV file.
Steps
-
Open the dashboard.
-
On the metric card, select More actions (the three dots).
-
Select View as table.
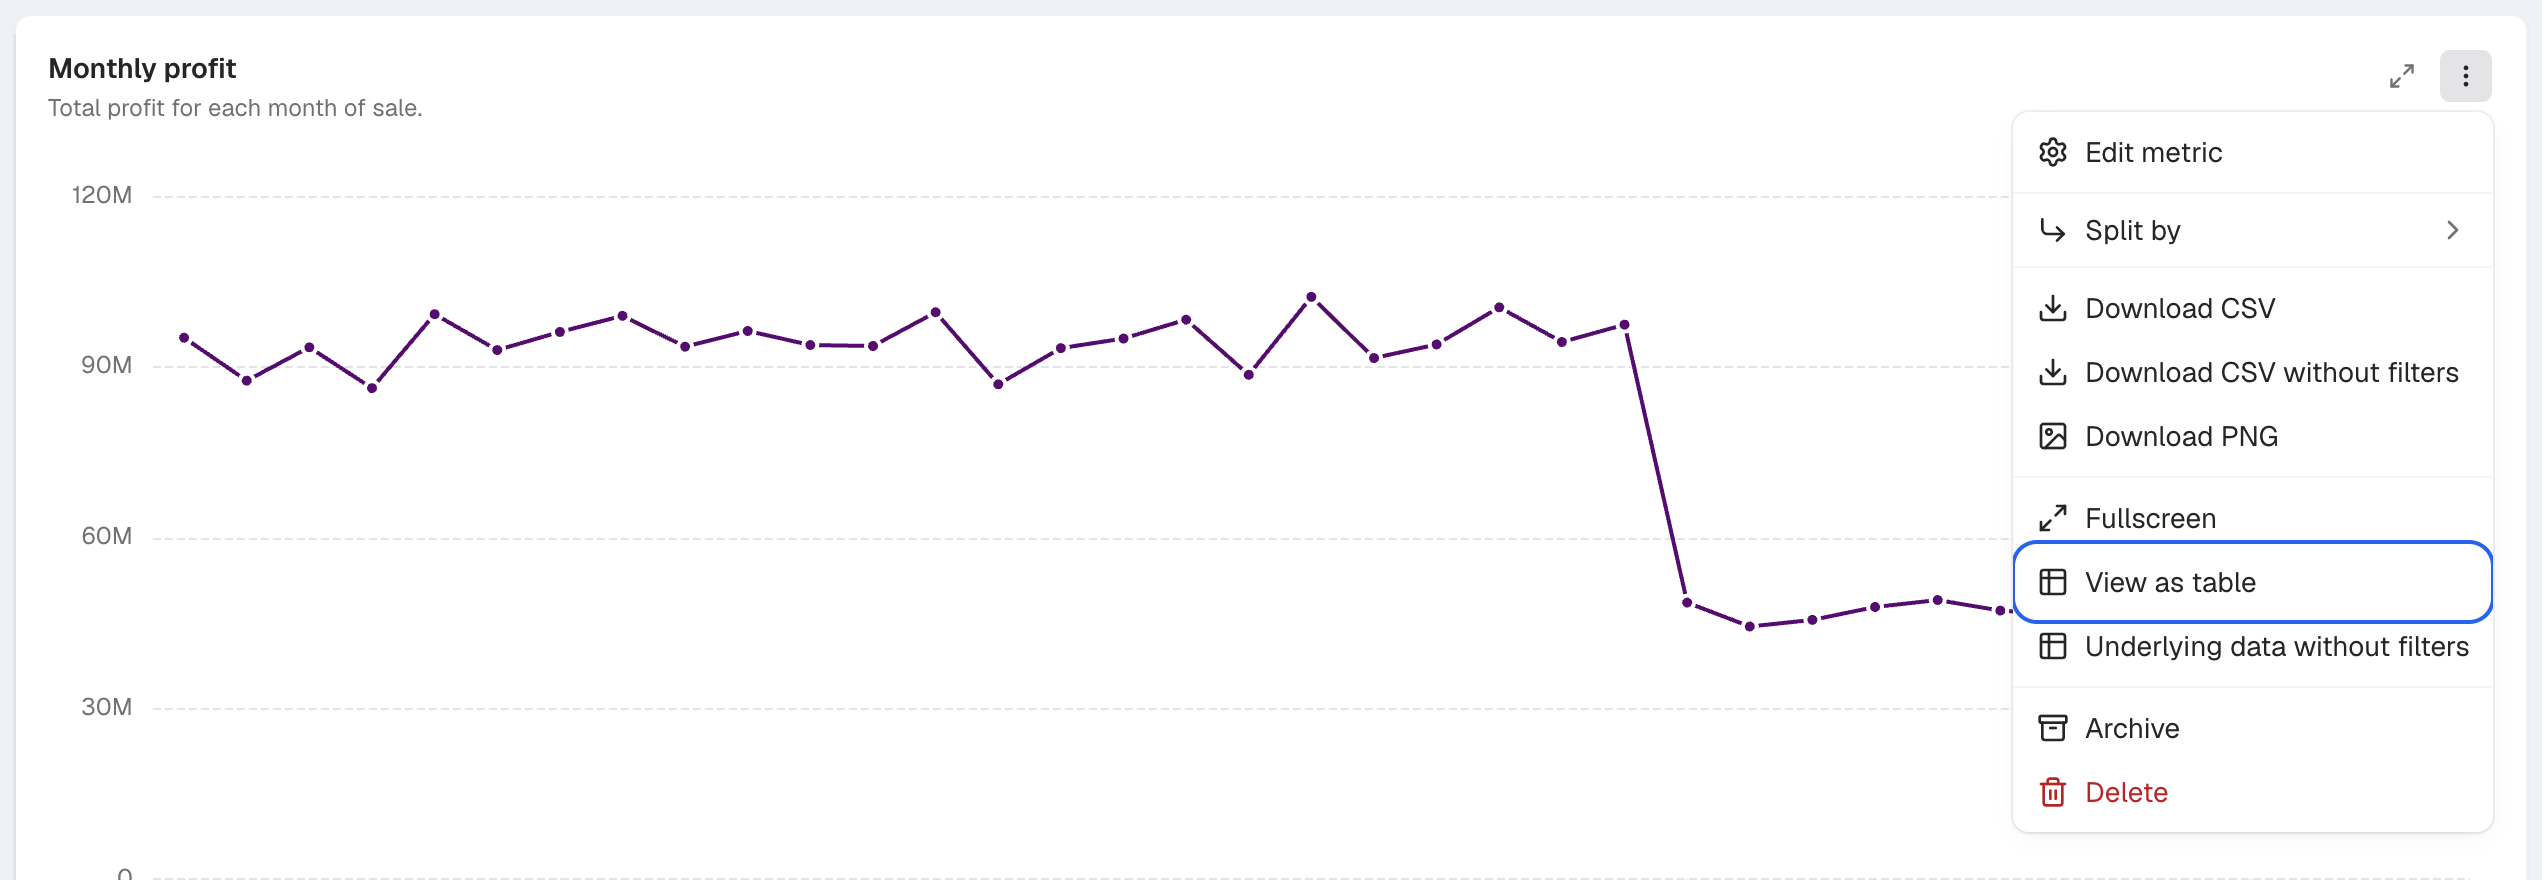
View as table opens the Underlying data dialog. -
In the Underlying data dialog, select Download.
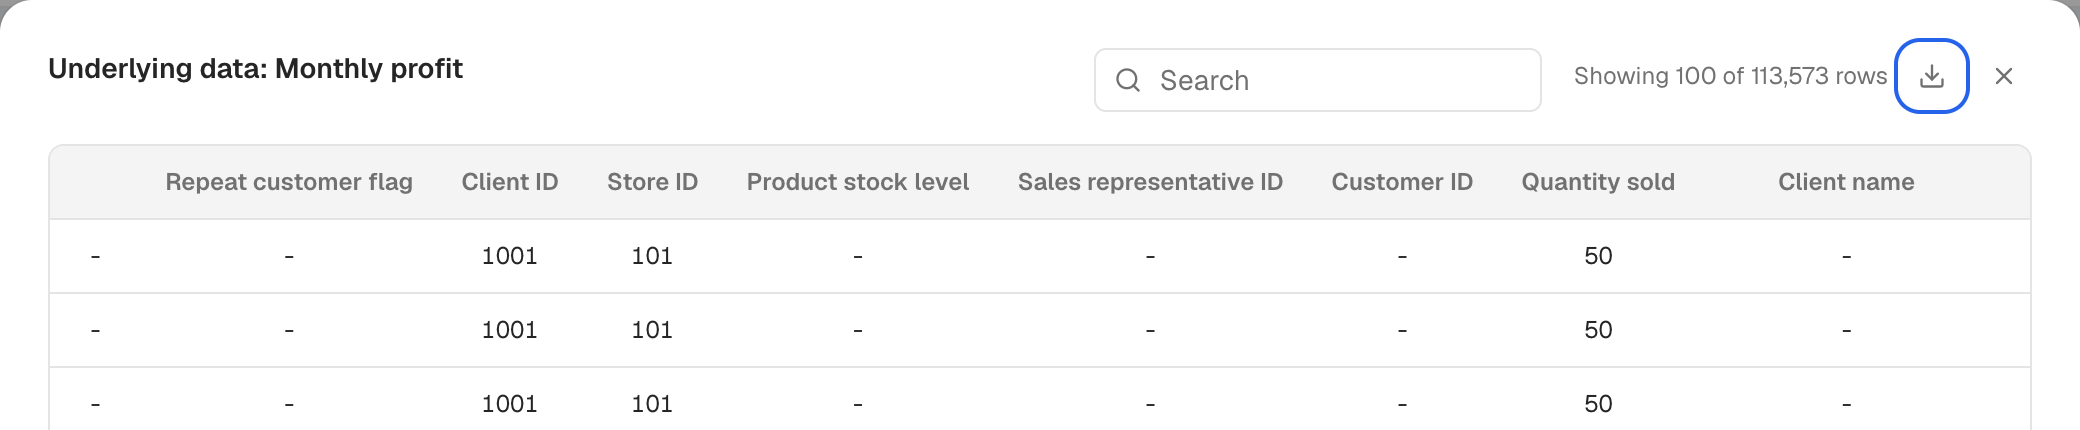
The Download icon is next to the row count. -
Select Download with Filters or Download Raw Data.
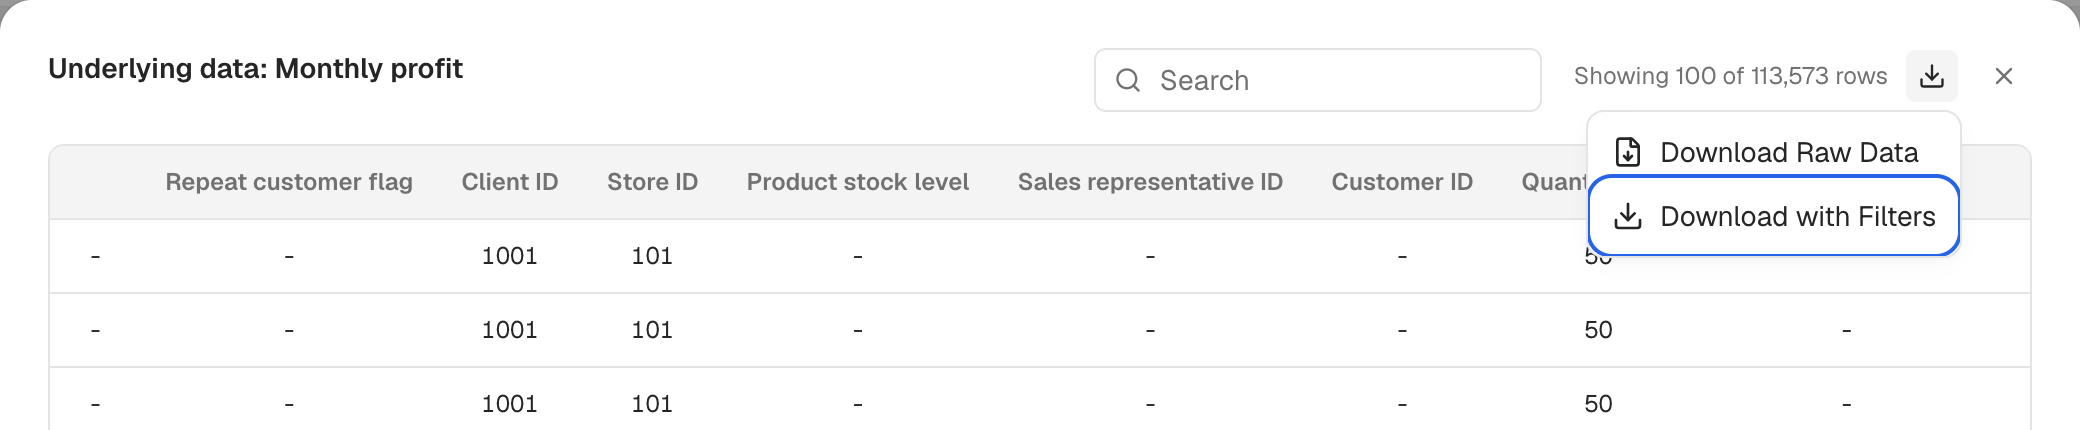
Pick Download with Filters to keep the filters, or Download Raw Data to drop them.
You get <card title>.csv.
- Download with Filters keeps the dashboard and metric filters.
- Download Raw Data drops the dashboard and metric filters. Your access rules still apply.
Other ways to open the rows
- More actions > Underlying data without filters opens the rows with no dashboard or metric filters.
- Right-click a point on the chart and select View underlying data to see only the rows behind that point.
The dialog shows 100 rows at a time. Use Search these rows to find a value.
Limits
- CSV only.
- Each request returns at most 5,000 rows.
- Download with Filters fetches all rows in steps of 5,000, up to 200,000 rows. For more, narrow the metric or use a scheduled report.
- Columns hidden under Hide Column from underlying data in the metric’s chart actions are not shown.
In an embedded dashboard, end users see underlying data only when the embed access setting Underlying Data is on, or their guest token allows it.
If something goes wrong
- This export stopped at the first 200,000 rows. Narrow the metric or use a scheduled report for the full result.
- We couldn’t download every row. Check your connection and try again, or download the page you see.