

Metrics
Add a footnote and long description
Add a note under a metric's chart and a longer explanation behind the info icon next to its title.
- Long description shows in a tooltip when a viewer points at the info (i) icon next to the card title.
- Footnote shows as a line of text under the chart.
Steps
-
Open the metric in the metric builder.
-
Select Save to dashboard.

Save to dashboard is at the top right of the metric builder. -
Select Advanced options.
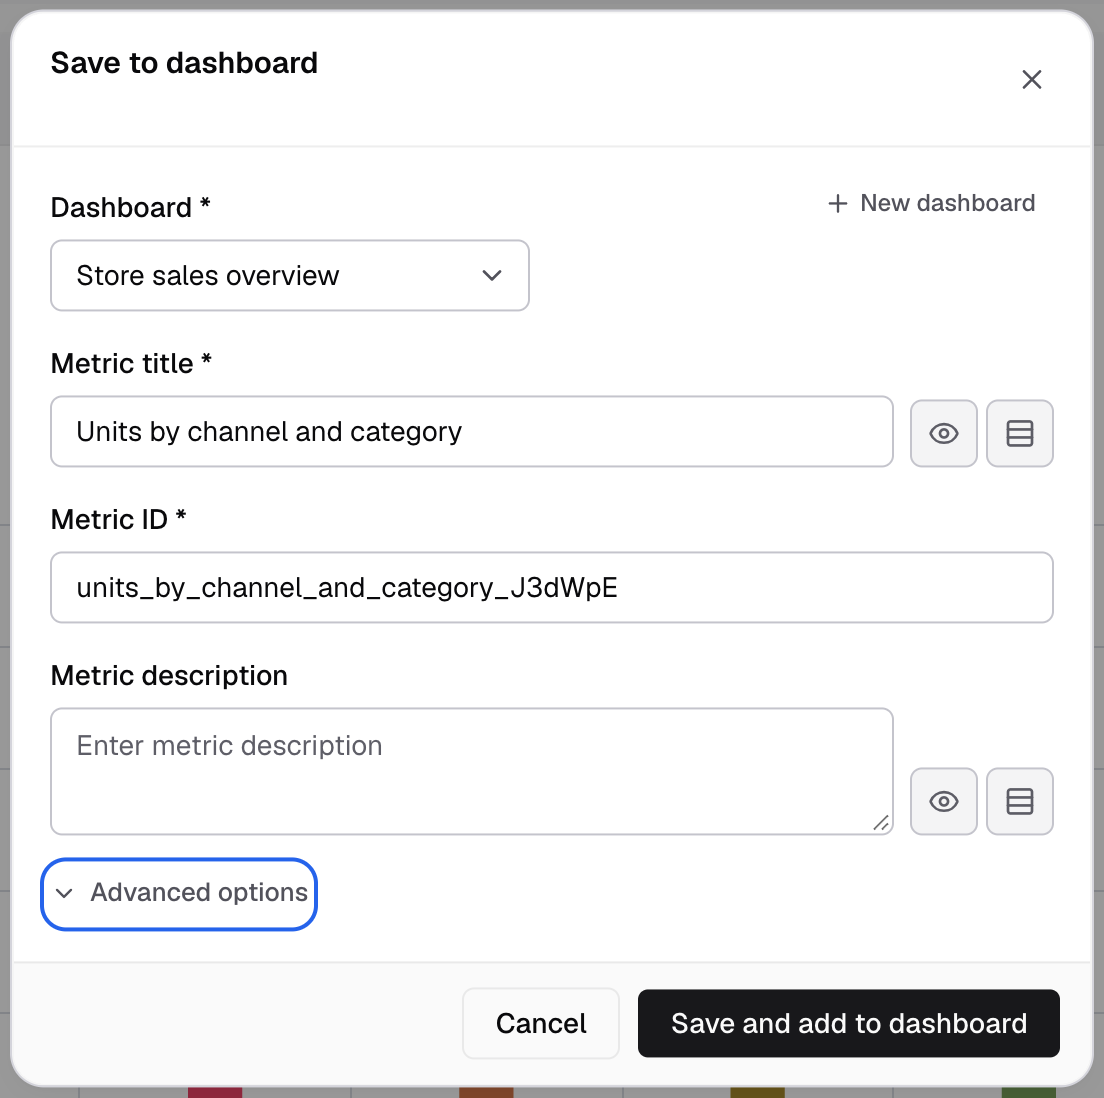
Advanced options is under Metric description. -
In Long description, enter the explanation, for example
Paid orders only. Refunds are not included.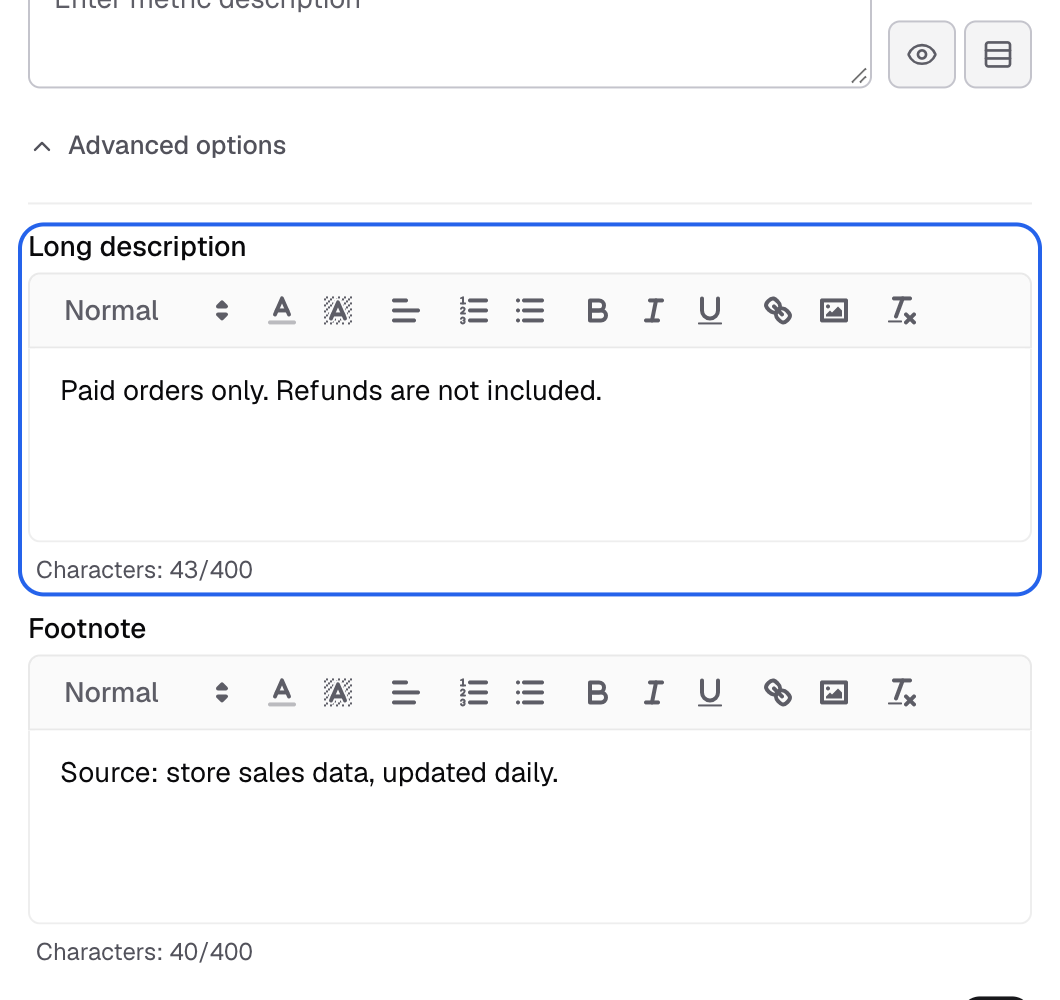
Long description shows behind the info icon next to the card title. -
In Footnote, enter the note, for example
Source: orders table, updated every hour.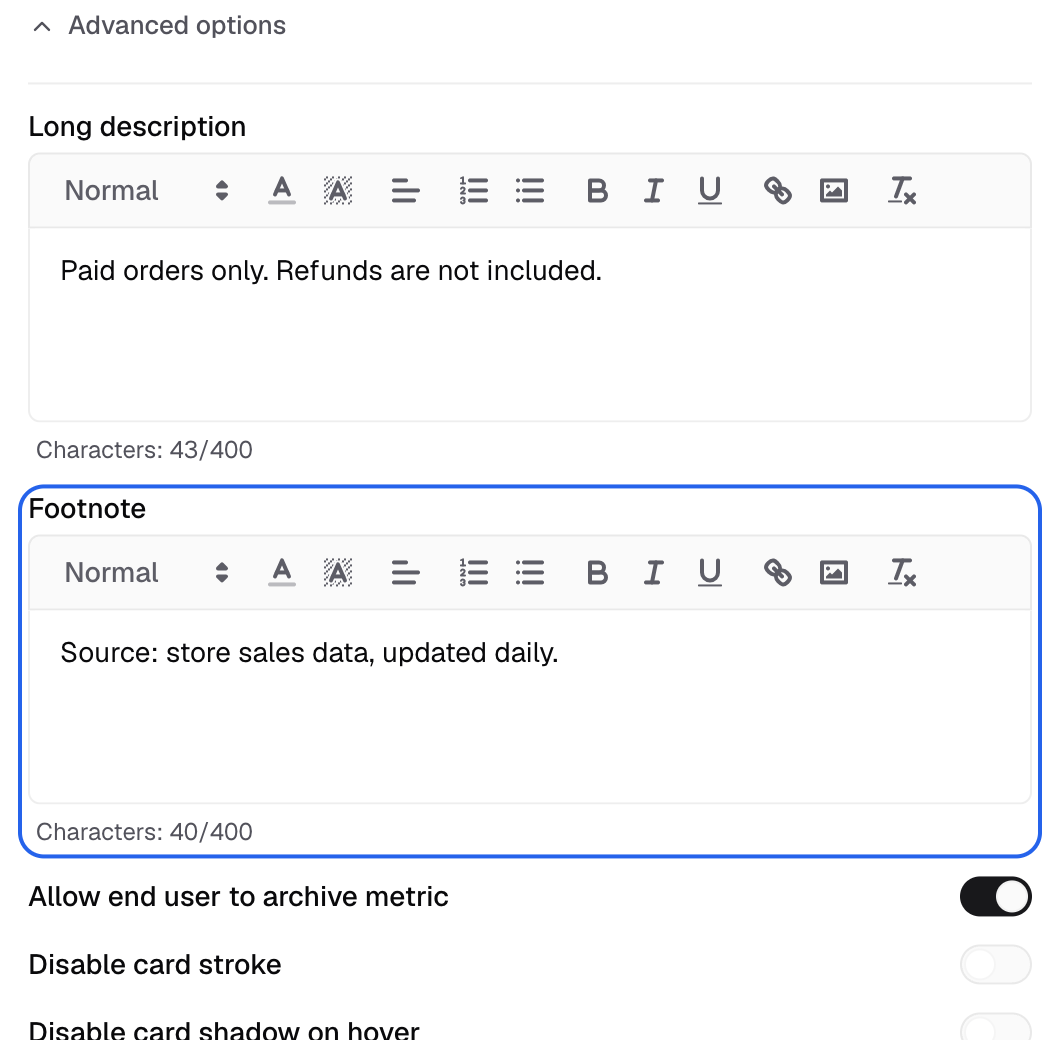
Footnote shows as a line under the chart. -
Select Save and add to dashboard. If you did not pick a dashboard, the button is Save.
The card shows the info icon next to its title and the footnote under the chart.
What you can put in them
- Up to 400 characters each. The counter under each editor shows
Characters: n/400. - Rich text: text size and color, bold, italic, underline, lists, alignment, links and images.
- When you add a link, Open links in new tab is on by default.
- Dynamic property names such as
[[region]]are replaced with their values. See Dynamic properties.