

Metrics
Split a chart into series
Split a chart's measure into one series per value of a column, and let viewers pick the column.
This is the Group By in the Add filter menu above the chart. It sets the chart’s series. The Group By in the Query toolbar is a different control: it groups the rows of the query. See Joins, filters, sort and group by.
Before you start
- The metric has results.
- The chart is not Pivot Table V2, Pivot Table V3, Sankey, Bubble V2, Combo or Horizontal Combo.
- Drill down and the comparison filter are off.
Steps
-
Open the metric in the metric builder.
-
Select Add filter above the chart.

Add filter sits at the top left of the chart, under the Chart, Table and Query tabs. -
Select Group By.
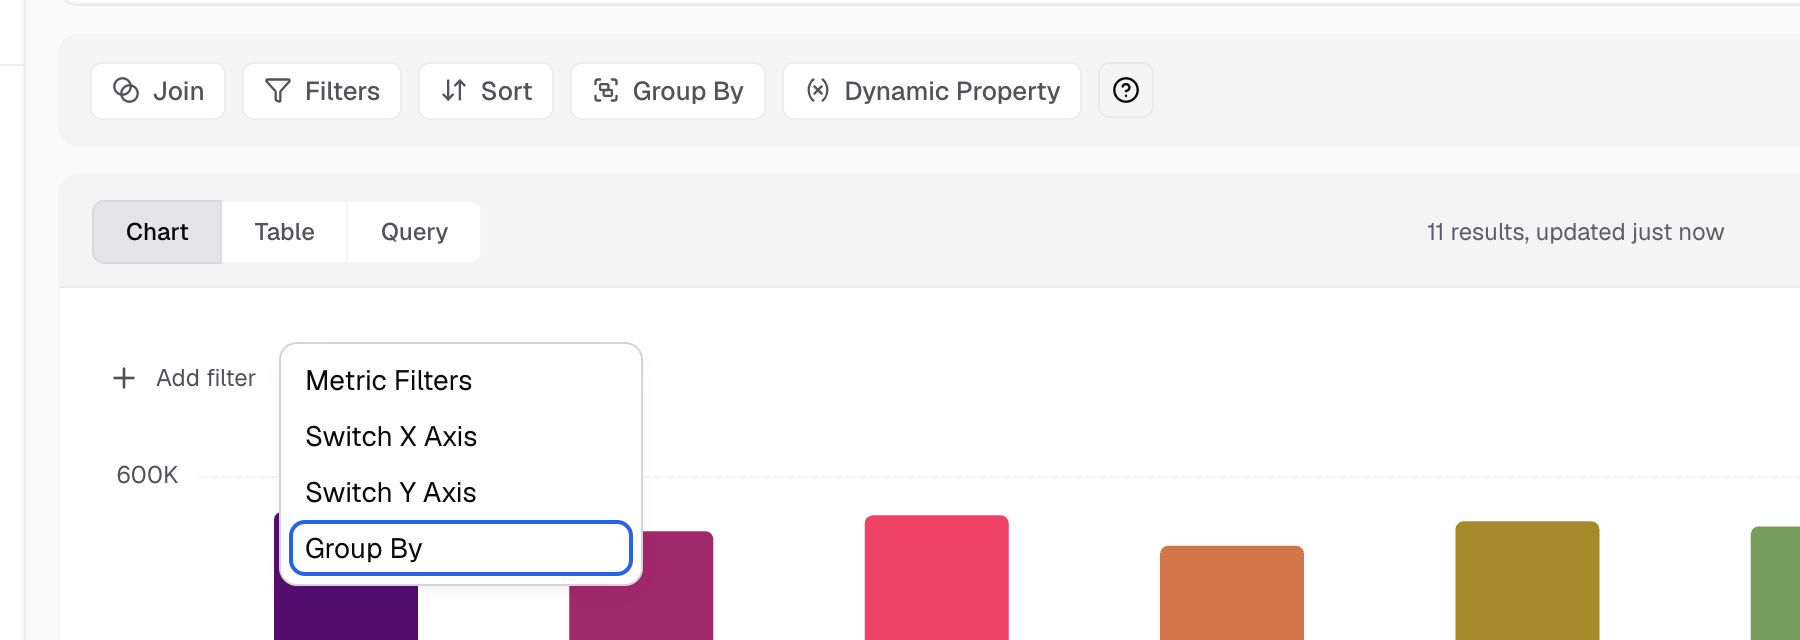
Group By is the last item in the Add filter menu. -
In Series Column, select the column to split by.
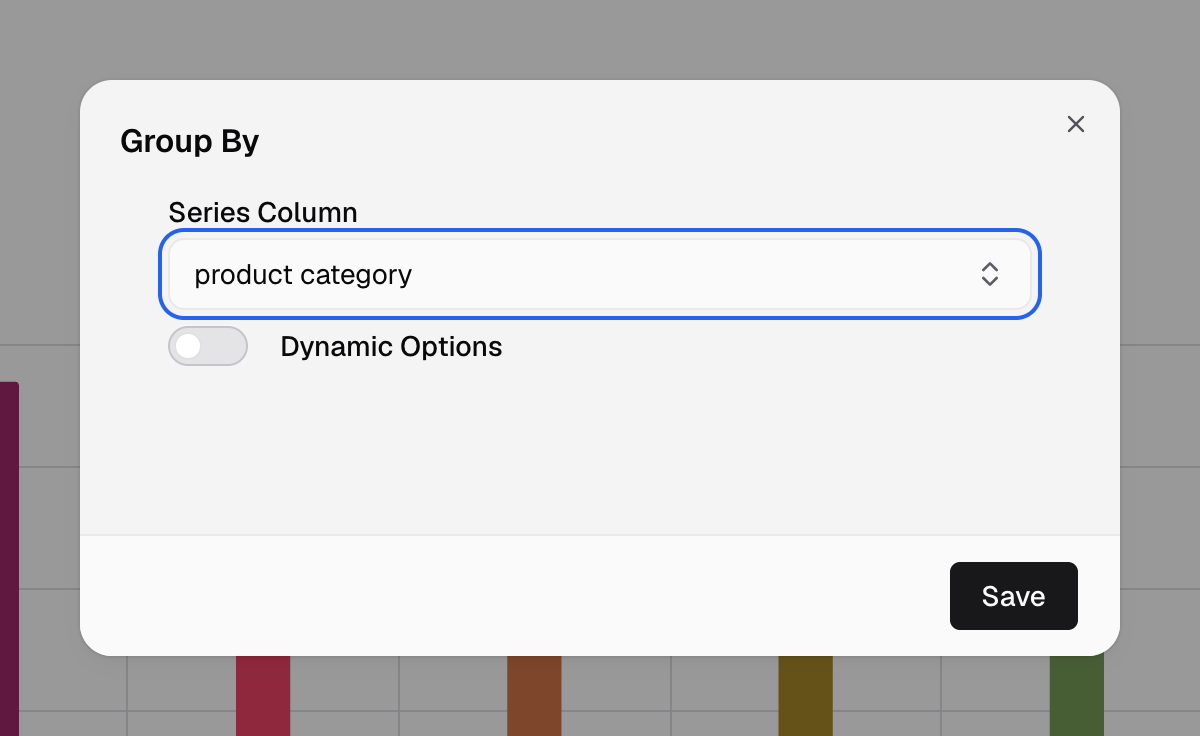
Series Column sets the column that splits the bars into series. -
Select Save.
The chart shows one series for each value of that column.
Let viewers pick the series column
-
In the Group By dialog, turn on Dynamic Options.
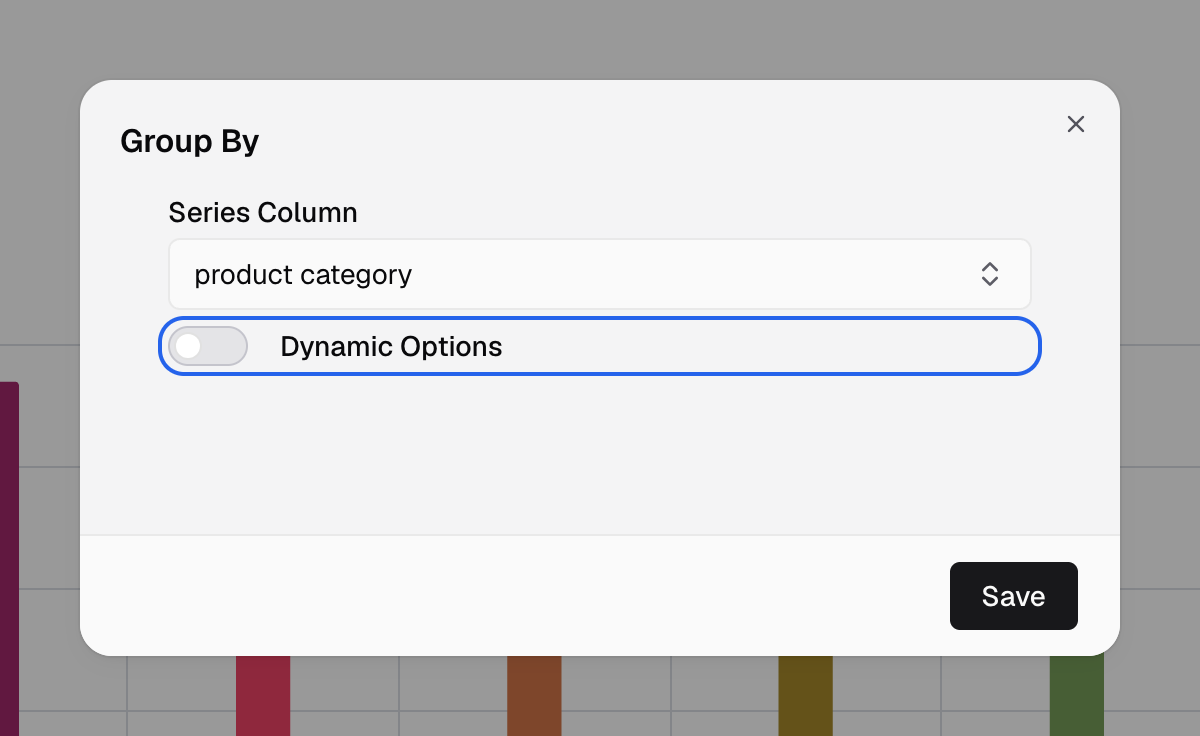
Dynamic Options lets viewers pick the series column. -
In Series Column, select each column viewers can pick from.
-
Optional: in Alias for Ungrouped, enter the label for the choice with no split, for example
All. -
Optional: turn on Enable the Clear Option so viewers can remove the split.
-
Select Save.
On a Hybrid Bar chart, the dialog also has Stack Measures. Select the measures to stack.