

Chart actions
Chart actions
Decide what happens when a viewer clicks a chart or a card.
Set click links, drill down, hidden columns and alerts for one metric, in the metric’s Actions tab.
Before you start
- Your role can see actions. The default Admin, Editor and Developer roles can. The Viewer role cannot.
- The metric does not use raw SQL mode. In raw SQL mode the Actions tab is off.
- The chart is not a gauge, linear gauge, progress bar or Gantt chart. These chart types have no Actions tab.
Open the Actions tab
-
Open the metric in the metric builder.
-
In the chart toolbar, select Appearance.
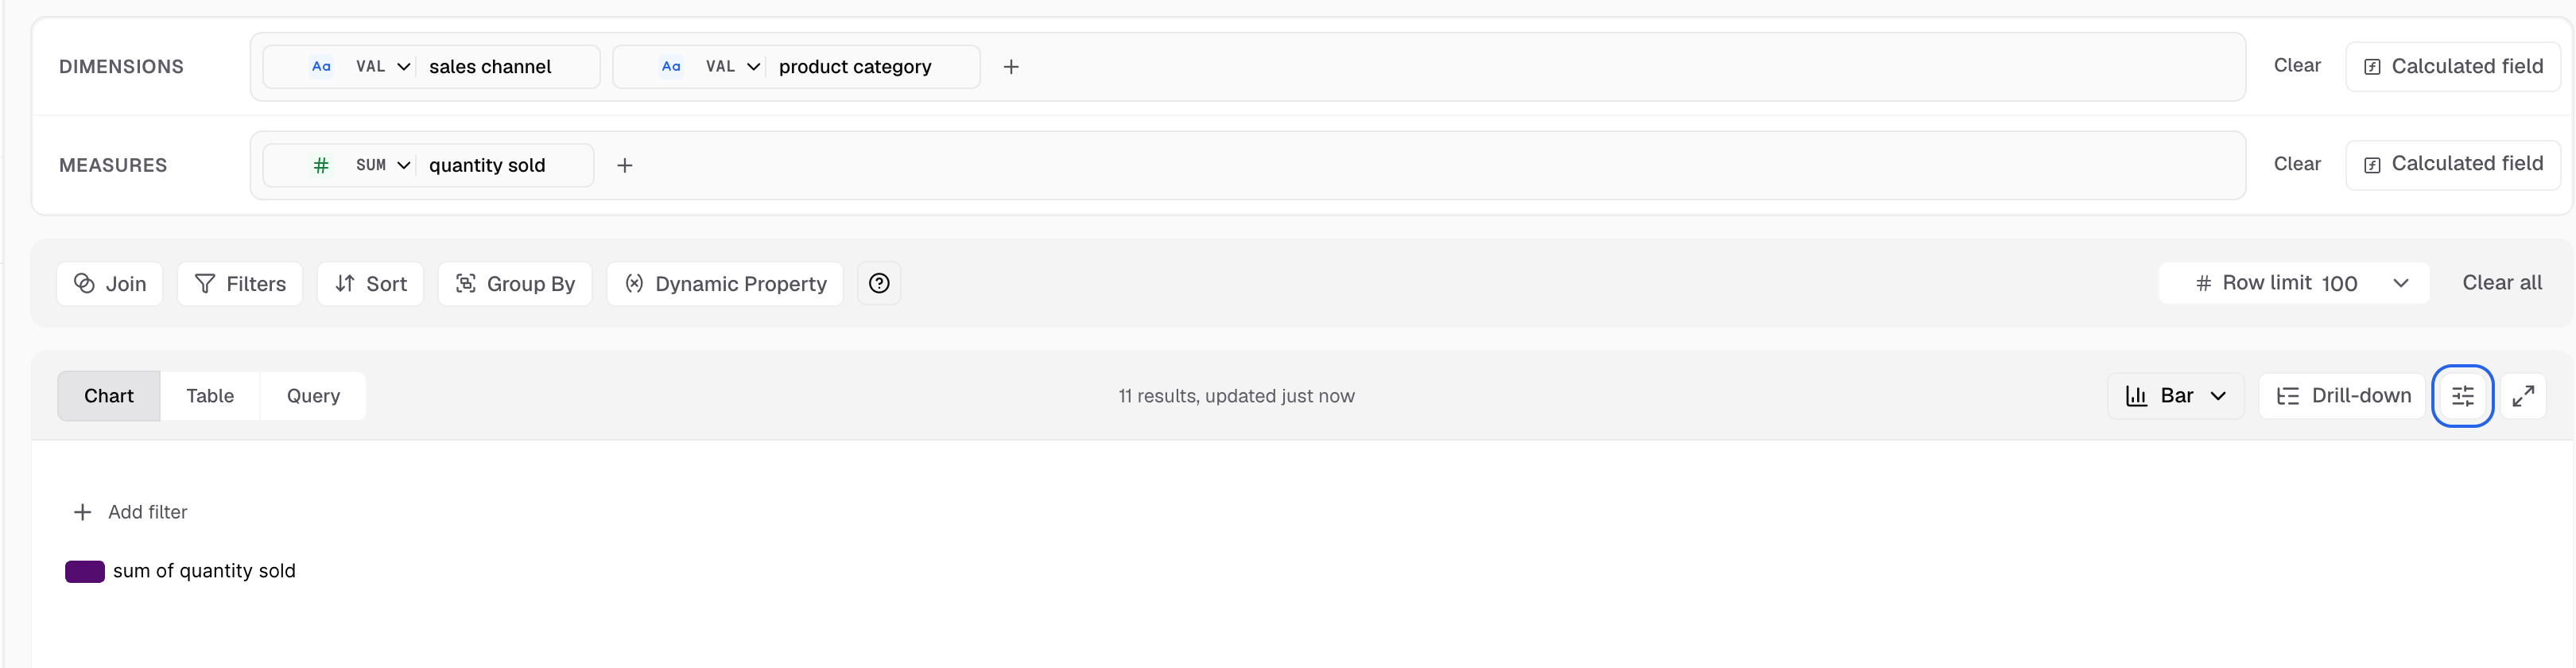
Appearance is the sliders icon next to Drill-down. -
In Chart settings, select Actions.
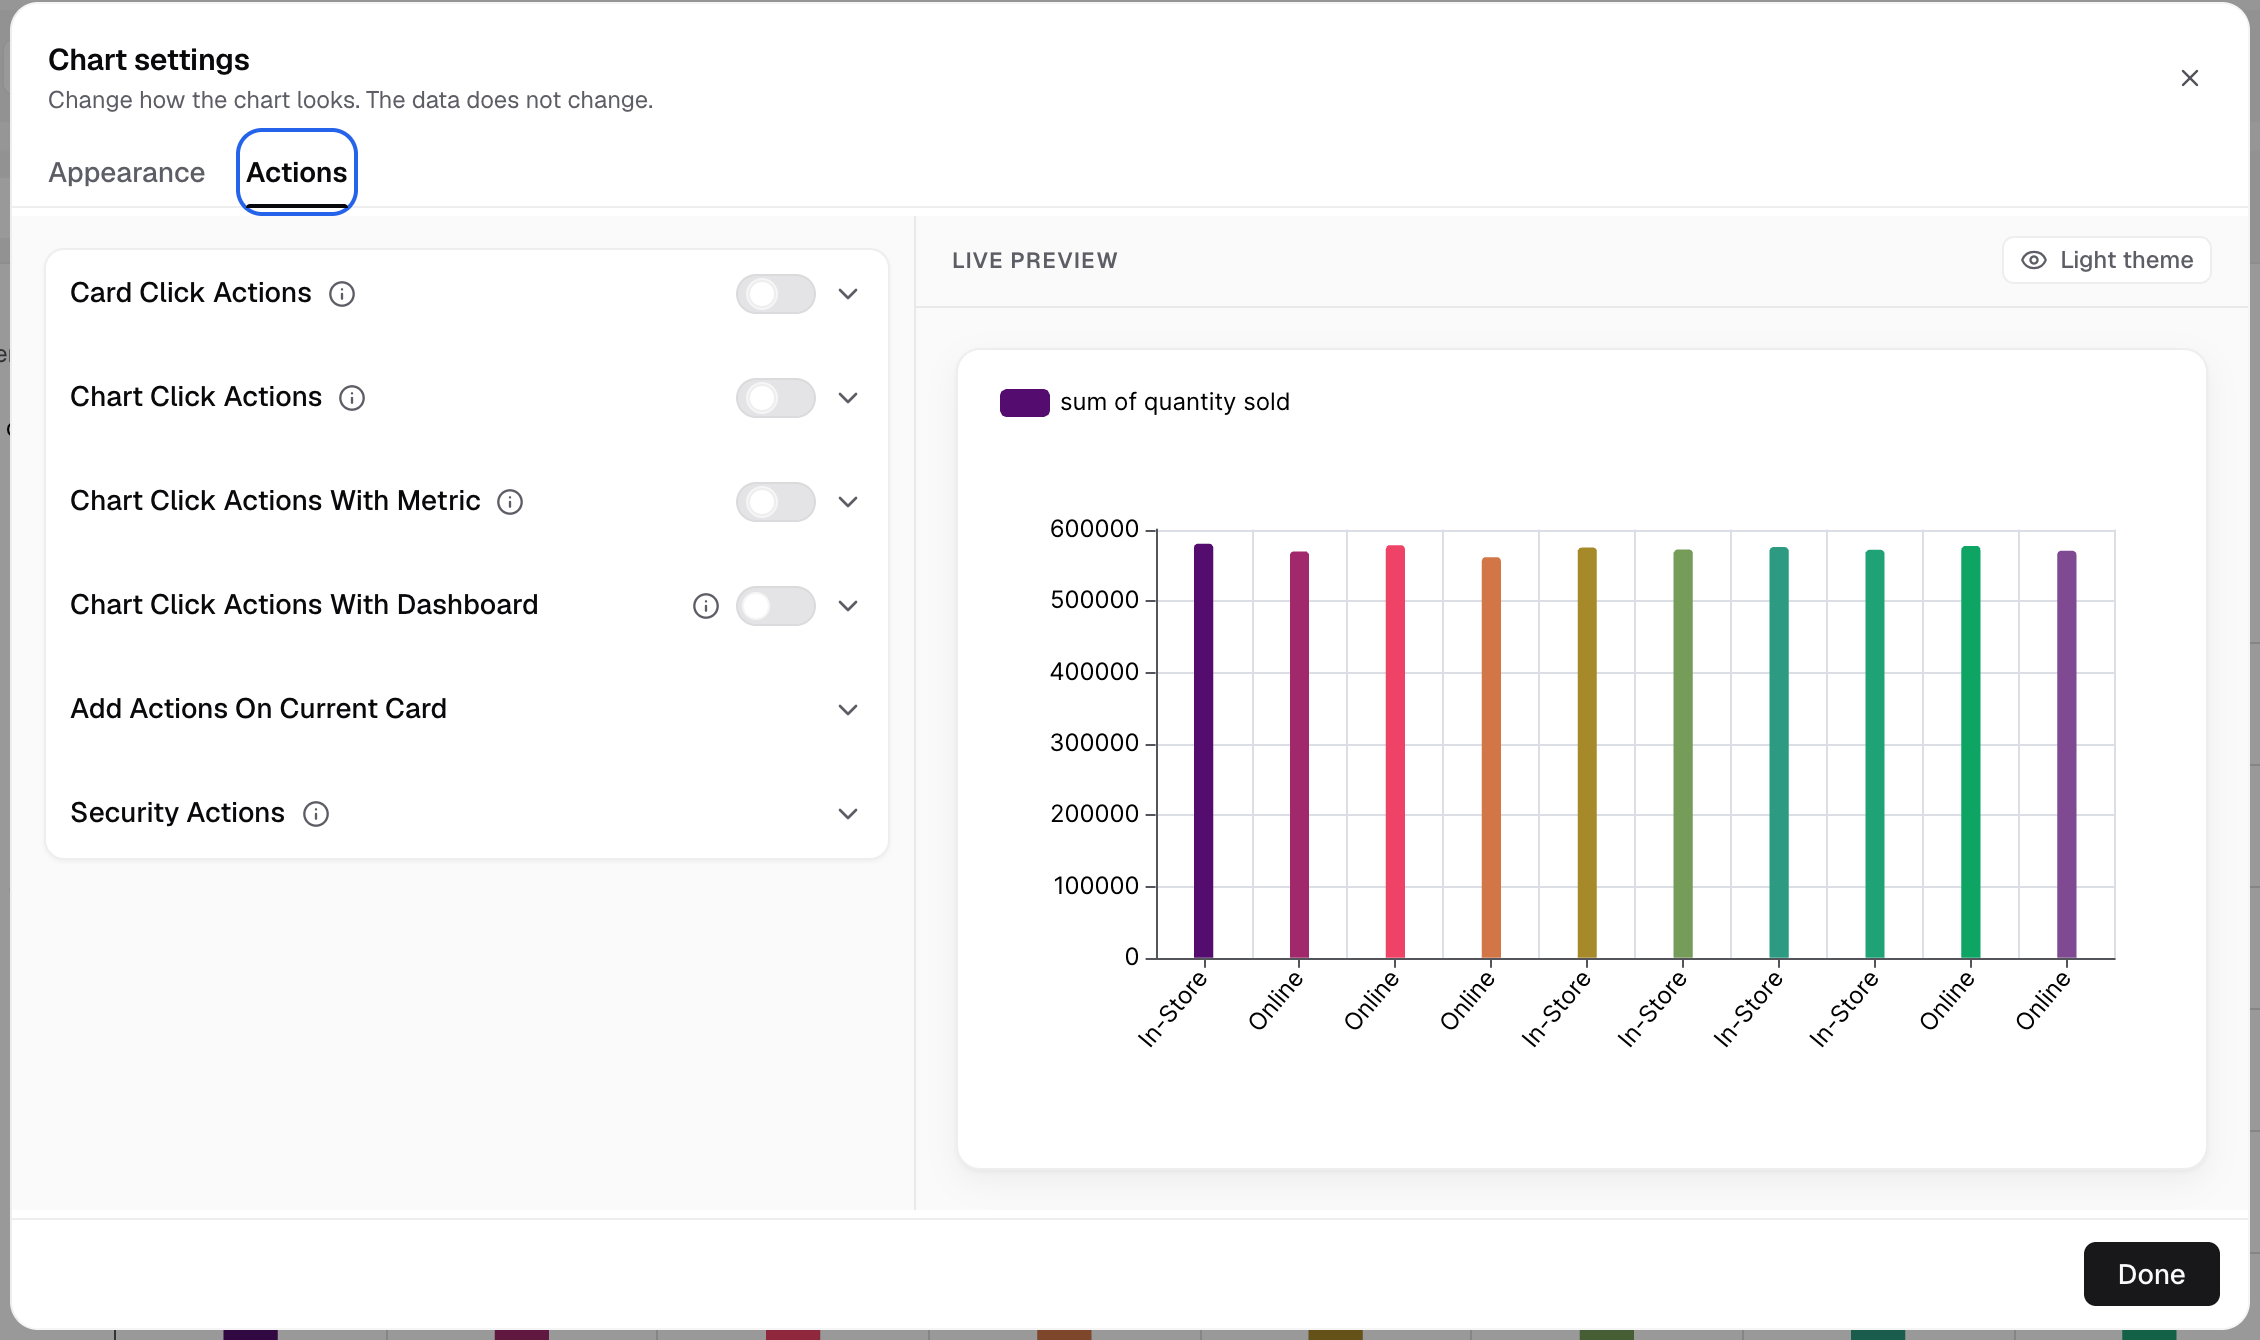
The Actions tab lists every action group. Turn one on to set it up.
What each group does
| Group | What it does | Guide |
|---|---|---|
| Card Click Actions | Adds an Open linked page button to the card header. | Add a card click action |
| Chart Click Actions | Opens a URL with the clicked value, or sends the value to your code. | Add a chart click action |
| Chart Click Actions With Metric | Opens another metric of the same dashboard in full screen. | Open a metric from a chart |
| Chart Click Actions With Dashboard | Opens another dashboard, filtered to the clicked value. | Open a dashboard from a chart |
| Custom Underlying Data | Shows your own SQL result as the underlying data of a single value card. | Below |
| Add Actions On Current Card | Viewer controls: group, sort, switch axes, comparison, drill down, forecast. | Set up drill down |
| Security Actions | Hides columns from underlying data and from CSV downloads. | Below |
| Alerts and Signals | Sends an email when a single value goes above or below a limit. | Below |
Each click group has an on and off switch in its header. Turn it on to see its fields.
Add Actions On Current Card holds these rows:
- Group X-axis. See Group by.
- Sort on metric card. The viewer sorts the card for a moment. Your settings do not change.
- Switch X axis and Switch Y axis. See Switch axes.
- End user measures and dimensions. The viewer picks from the Dimensions and Measures you allow.
- Comparison Filter. Line charts only.
- Drill down, and under it Cross Dashboard Drill Down. See Filter the dashboard from a chart.
- Forecast. Not for time series charts.
When drill down is on
Drill down turns most other actions off. The tab says: “Drill down is on, so click actions and other card actions are off. Turn off drill down to set them.”
Chart Click Actions comes back when you select the last drill level. Card click, metric and dashboard click actions, security actions and alerts stay hidden.
Plan and role gates
- Drill down and Forecast need the Business plan or higher.
- Each group has its own role permission. The default Admin, Editor and Developer roles have all of them. The Viewer role has none.
- Cross Dashboard Drill Down needs the Cross Filter Dashboard permission of drill down.
Custom Underlying Data
For single value charts only. Write a SQL query. Viewers see its result when they open the card’s underlying data.
- Turn on Custom Underlying Data.
- Enter your query in the SQL editor. Select Format to tidy it.
- Select Validate Query. You see Success or the error.
Custom Underlying Data and Chart Click Actions cannot both be on. Turning one on turns the other off.
Security Actions
Choose columns that viewers must not see.
- Hide Column from underlying data: these columns do not show when a viewer opens the underlying data.
- Hide columns from CSV data: these columns are left out of CSV downloads.
Alerts and Signals
For single value charts only. Save the metric first. Alerts are off for a metric that is not saved.
- Open Alerts and Signals and select Add Alert.
- In Email ID, type an email address and press Enter.
- Enter a Title and a Message.
- Enter an Upper Limit, a Lower Limit, or both.
- Select Alert when above upper limit, Alert when below lower limit, or both.
- Set Alert Frequency, Interval and the alert expiration.
- Select Save.
The alert shows in the list. Use its menu to Edit or Delete it.
Next, add a chart click action.