

Chart types
Set up a Gantt chart
Show tasks as bars from a start date to an end date, in lanes.
Show each task as a bar from its start to its end, grouped in lanes.
Before you start
- The metric is grouped and has 4 or more dimensions. Gantt does not show until then.
What the data needs
Four dimensions, in this order:
| Order | Field | Type | Example |
|---|---|---|---|
| 1 | Lane | Text | team |
| 2 | Task | Text | task_name |
| 3 | Start | Date | start_date |
| 4 | End | Date | end_date |
Steps
-
Add the four fields to Dimensions in the order above.

Lane, task, start date and end date, in this order. -
Add a measure with an aggregate to Measures, for example
count(task_id).
Any aggregate works. COUNT of the task ID is the simplest. -
In the chart toolbar, select Chart type, then Gantt.
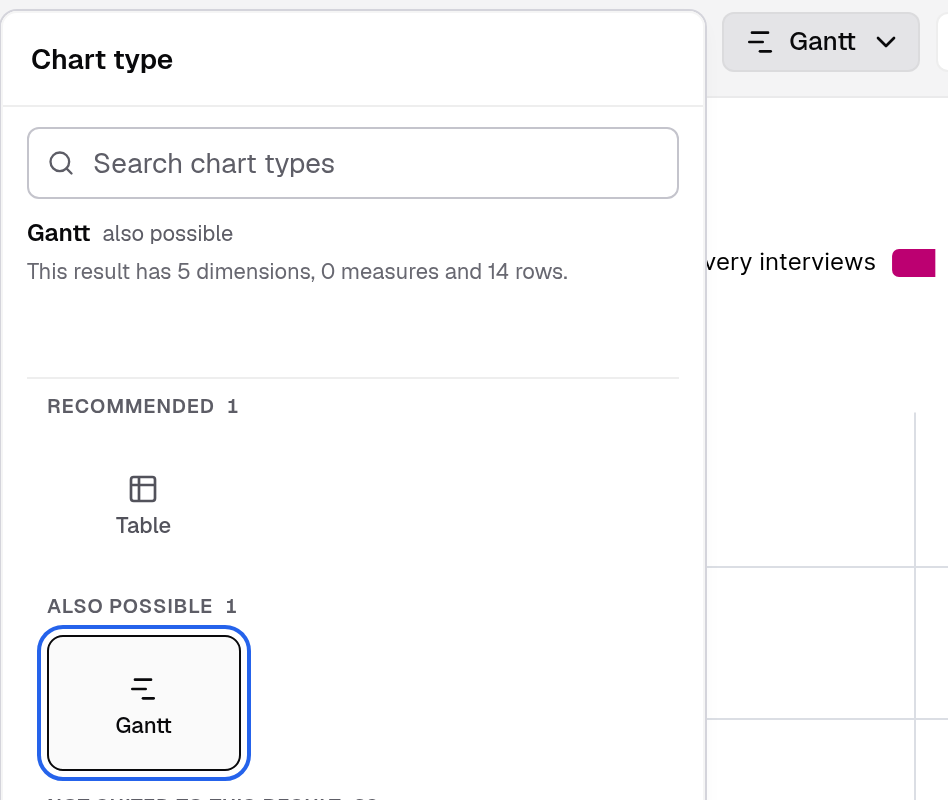
Gantt shows under Also possible when the result has the four dimensions. -
To choose what the tooltip shows, select Appearance in the chart toolbar. In Chart settings, open Advanced and set Tooltip keys under Chart tooltip.
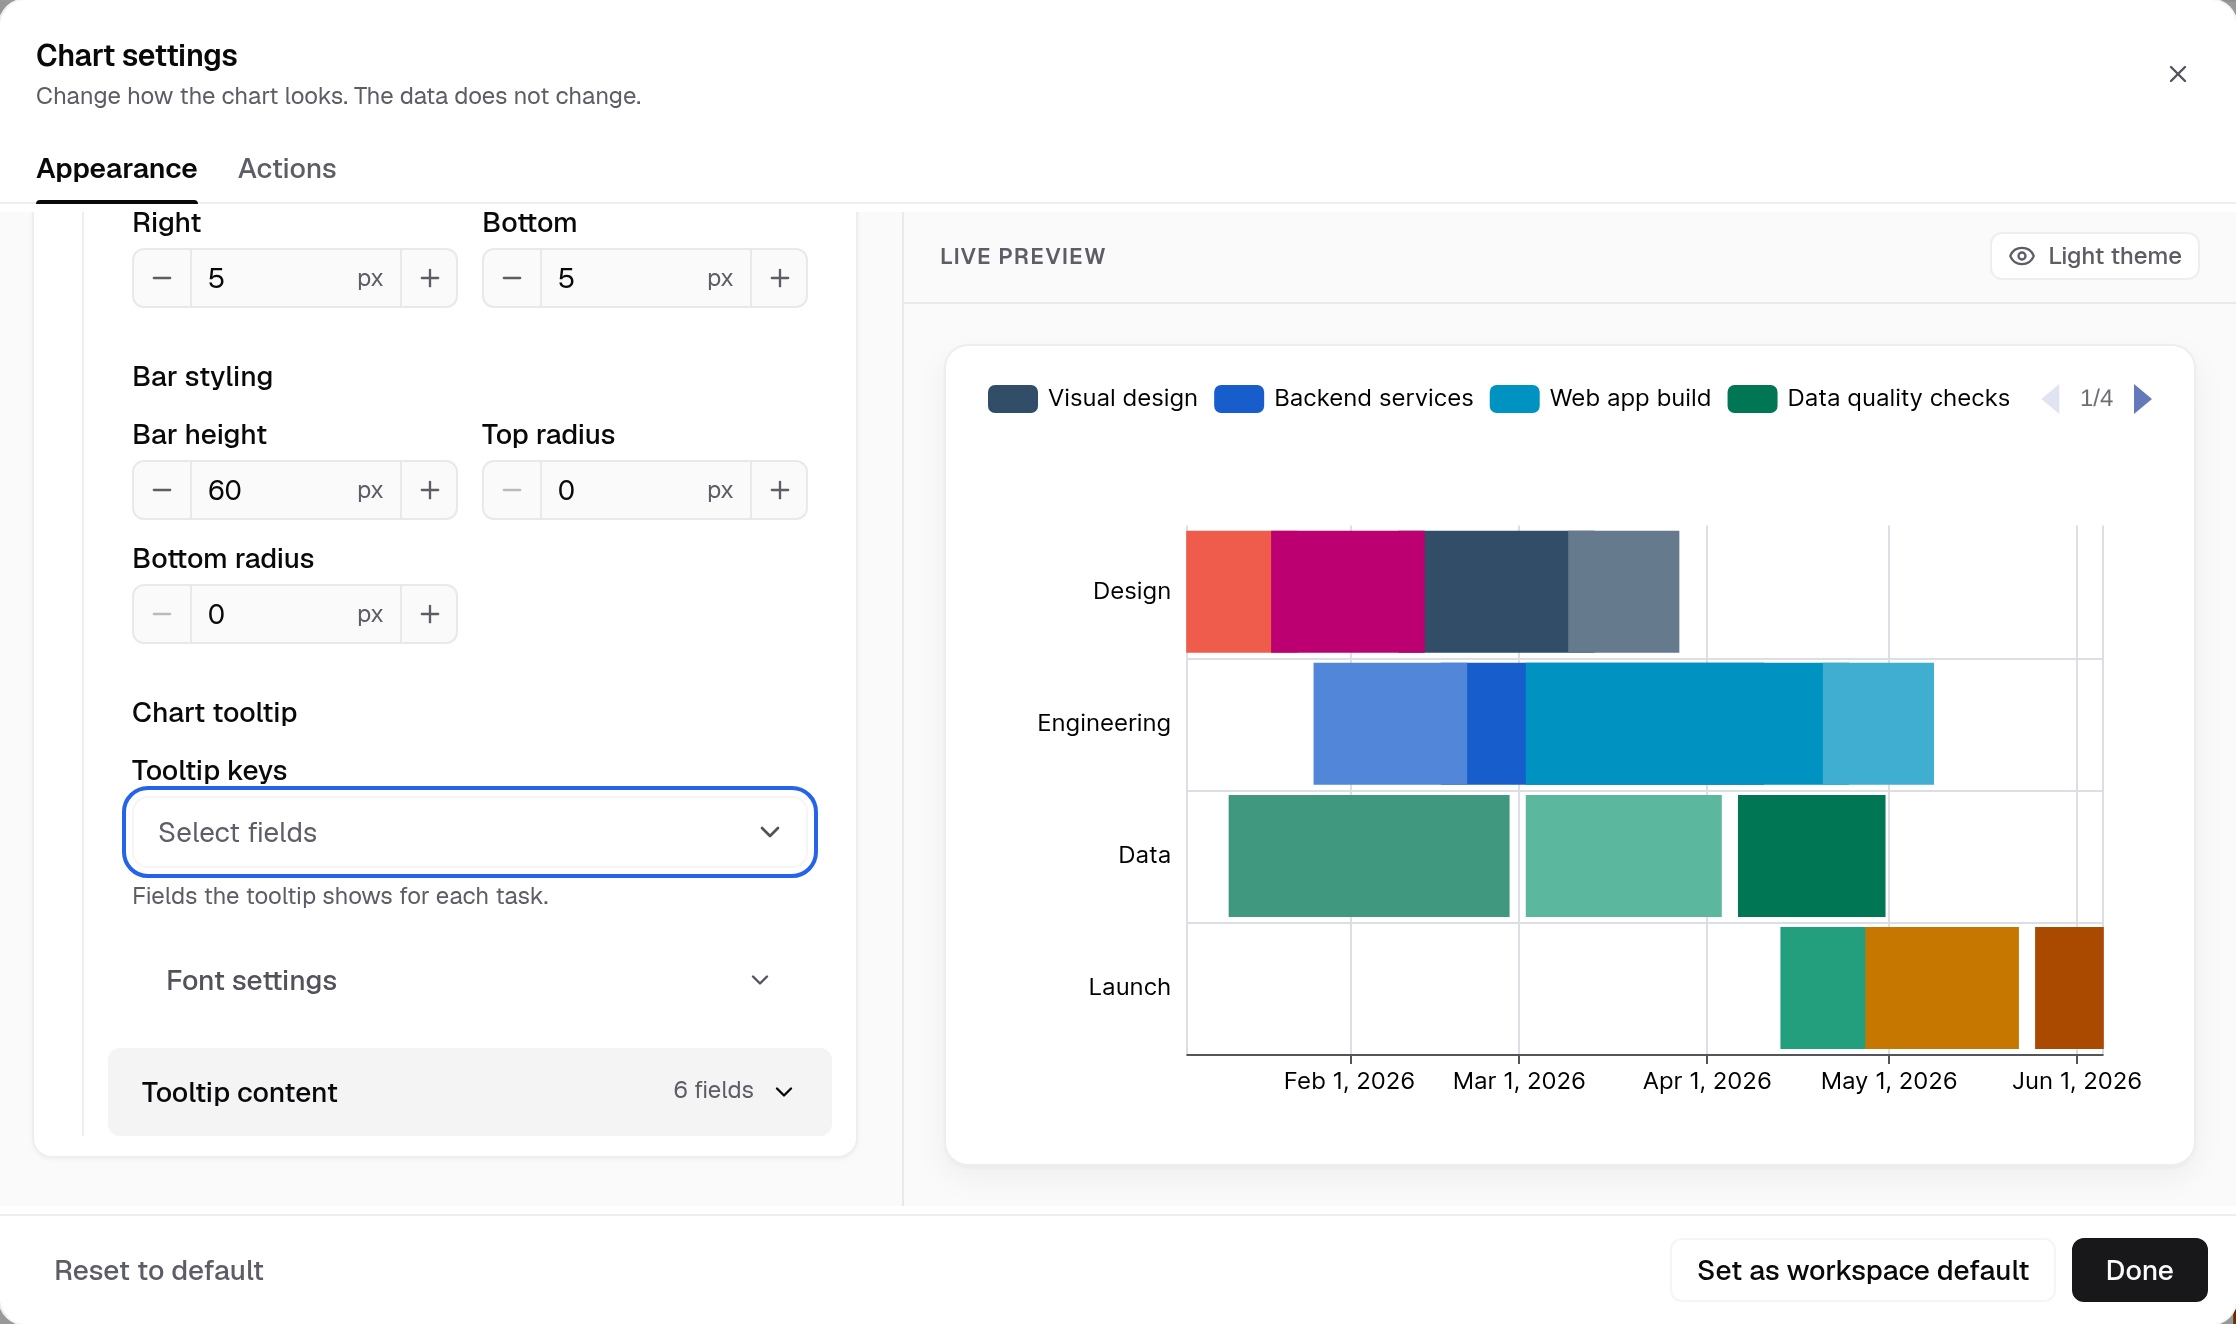
Tooltip keys picks the fields the tooltip shows for each task.
Each task shows as a bar in its lane.
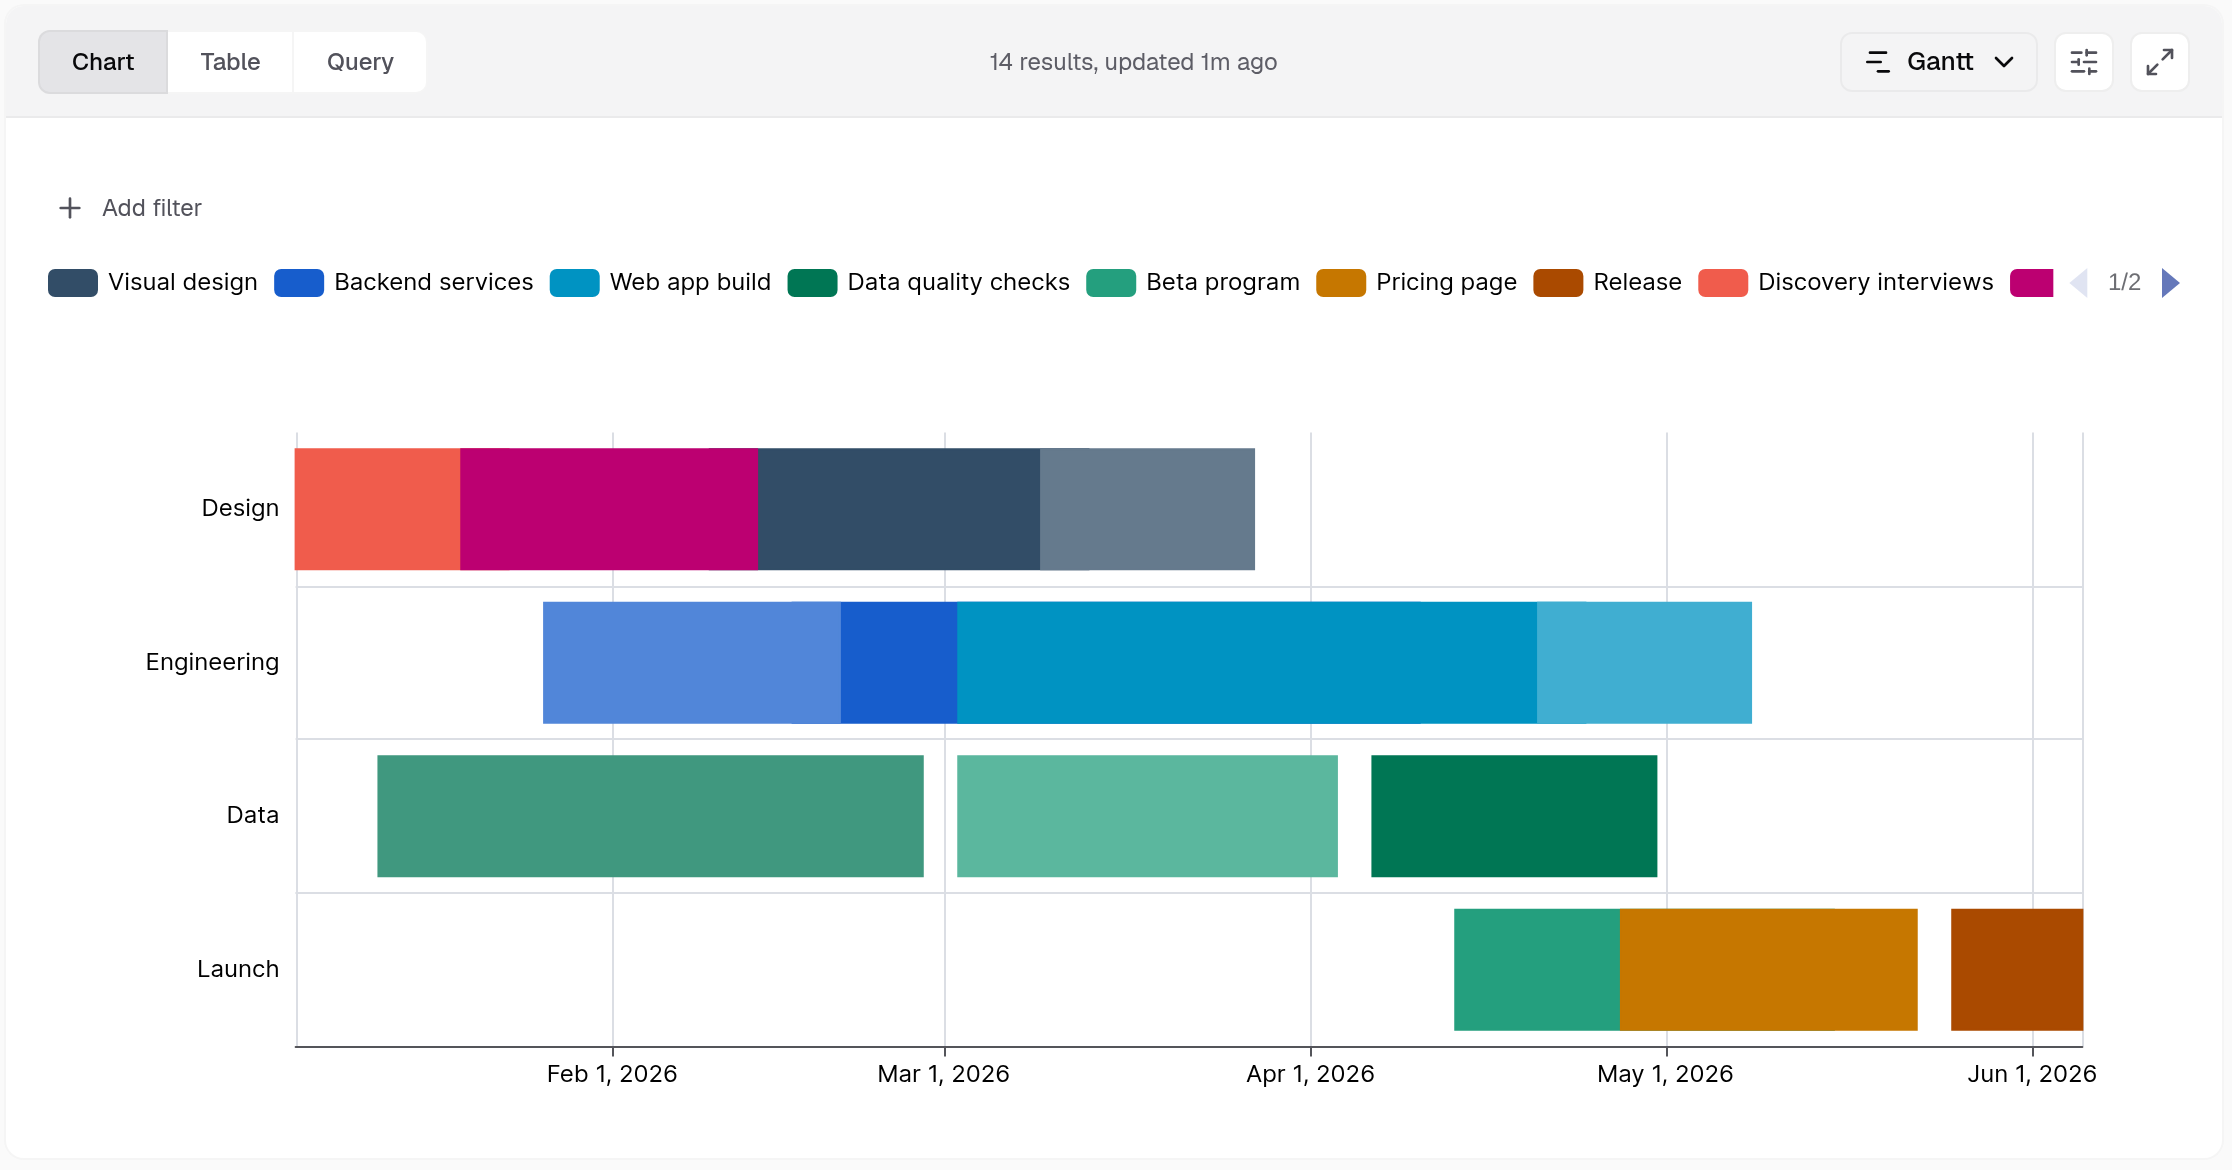
The Actions tab is greyed out for Gantt. Drill down does not work on it.
Next: change how the chart looks.