

Chart types
Set up a time series chart
Plot measures over real dates, grouped by day, week, month, quarter or year.
Plot measures on a real time axis. Gaps between dates keep their true size.
What the data needs
| Dimensions | Measures |
|---|---|
1 date or time column, for example created_at | 1 or more |
Steps
-
Add the date field to Dimensions.
-
Add one or more fields to Measures.
-
In the chart toolbar, select Chart type, then Time Series.
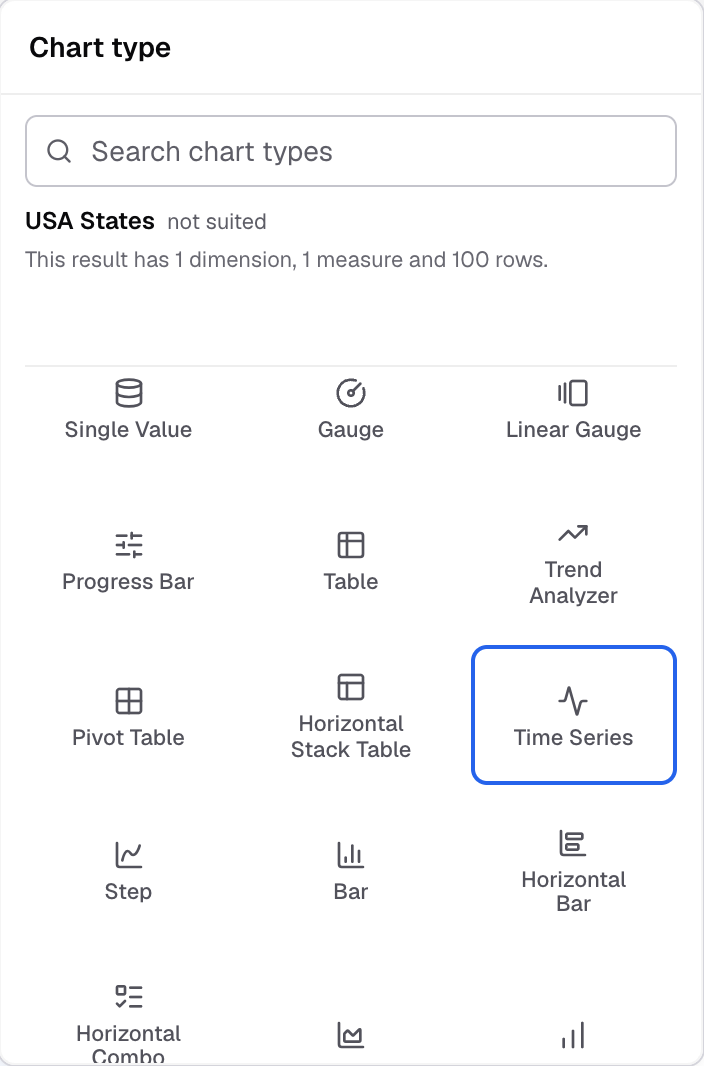
Time Series in the Chart type picker. -
Select Appearance, then open Features.
-
In Series type, choose Line, Bar, Area, Stack or Combo.
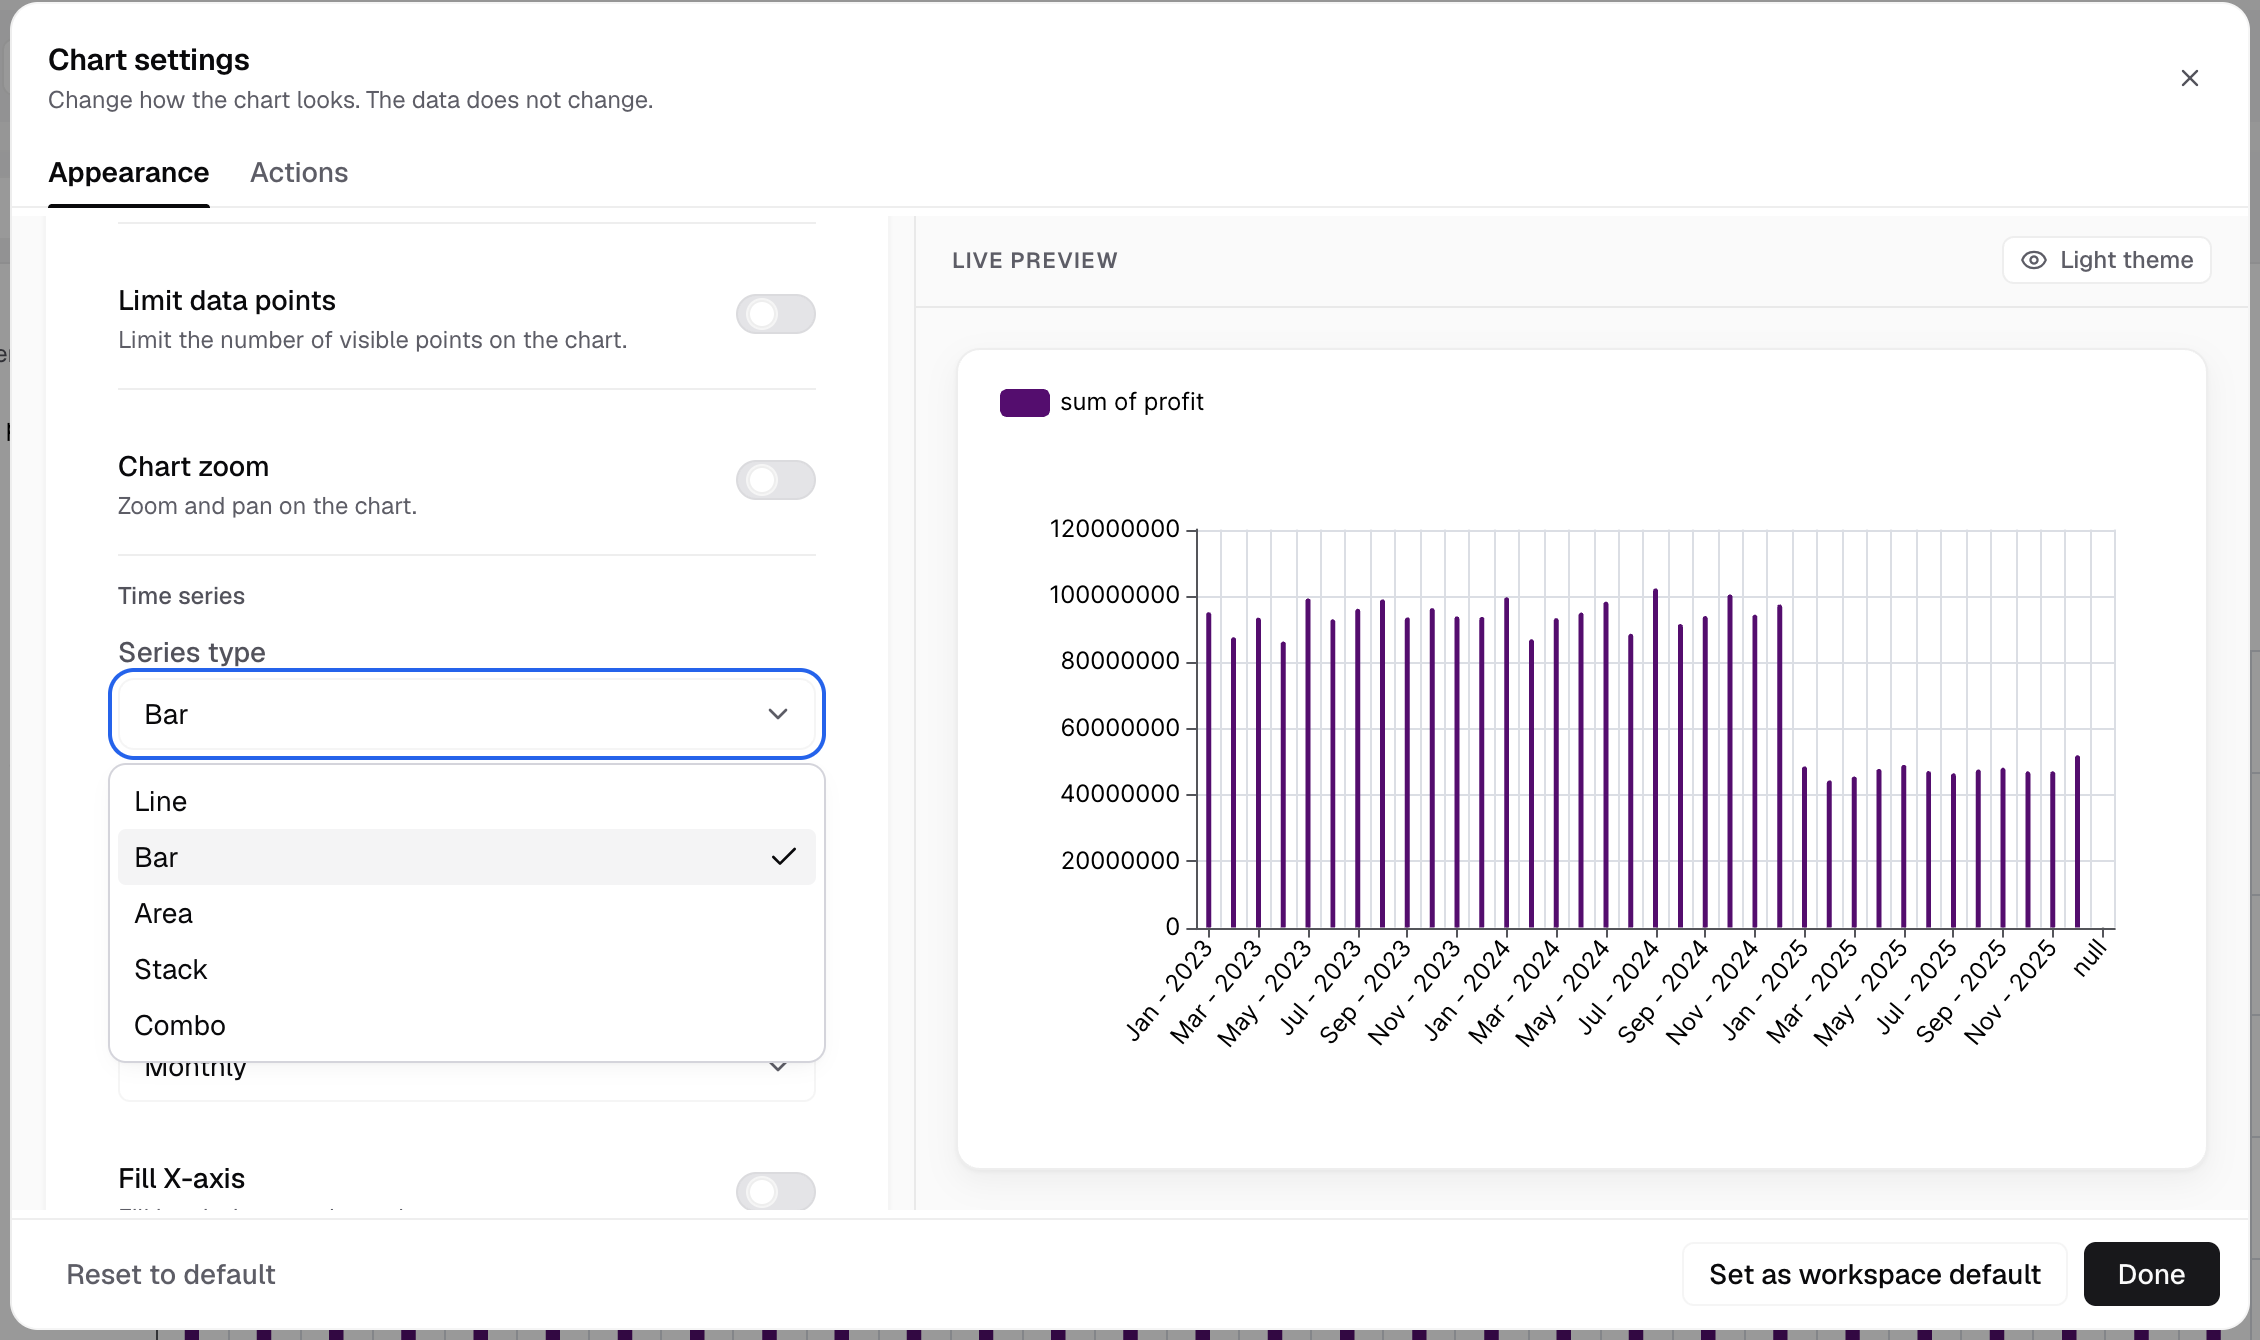
Series type is in the Time series block of Features. -
In Format type, choose Daily, Weekly, Monthly, Quarterly or Yearly.
The chart groups your data by the time period you chose.
Settings for this chart
- Group format: Default, Dynamic or Filter.
- Fill X-axis: fill in missing months or dates.
- Current line and Dashed line.
- Chart legend has Future legend.
- With Combo as the series type, Combo chart settings shows. Combo charts
Drill down does not work on a Time Series chart. Forecast is not offered for it.
If something goes wrong
- Time Series does nothing when you select it. The metric has no date column. Add a date or time field to Dimensions.
Next: change how the chart looks.