

Chart types
Set up a trend analyzer
Show the result as a simple grid. Trend Analyzer does not compute trends.
Show the result as a plain grid of rows and columns. Trend Analyzer does not compute changes, rates or averages. Compute those in the query.
What the data needs
Any columns. Every field in Dimensions and Measures is a column.
Steps
-
Add the fields to Dimensions and Measures.
-
In the chart toolbar, select Chart type, then Trend Analyzer.
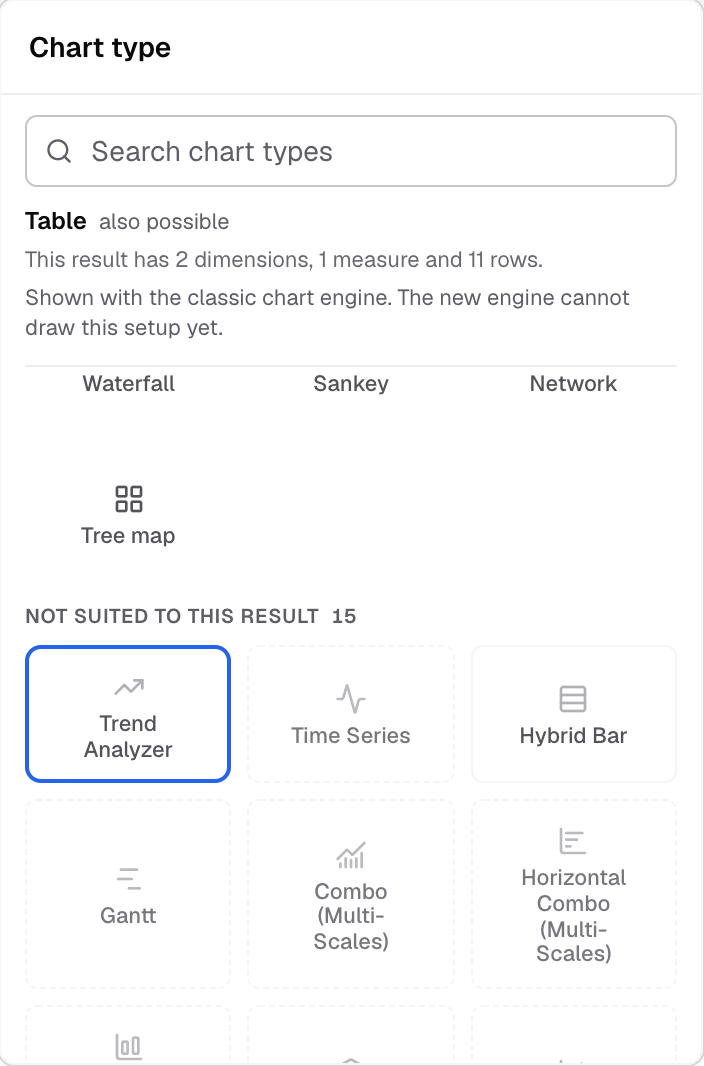
Trend Analyzer in the Chart type picker. -
To change how it looks, select Appearance.
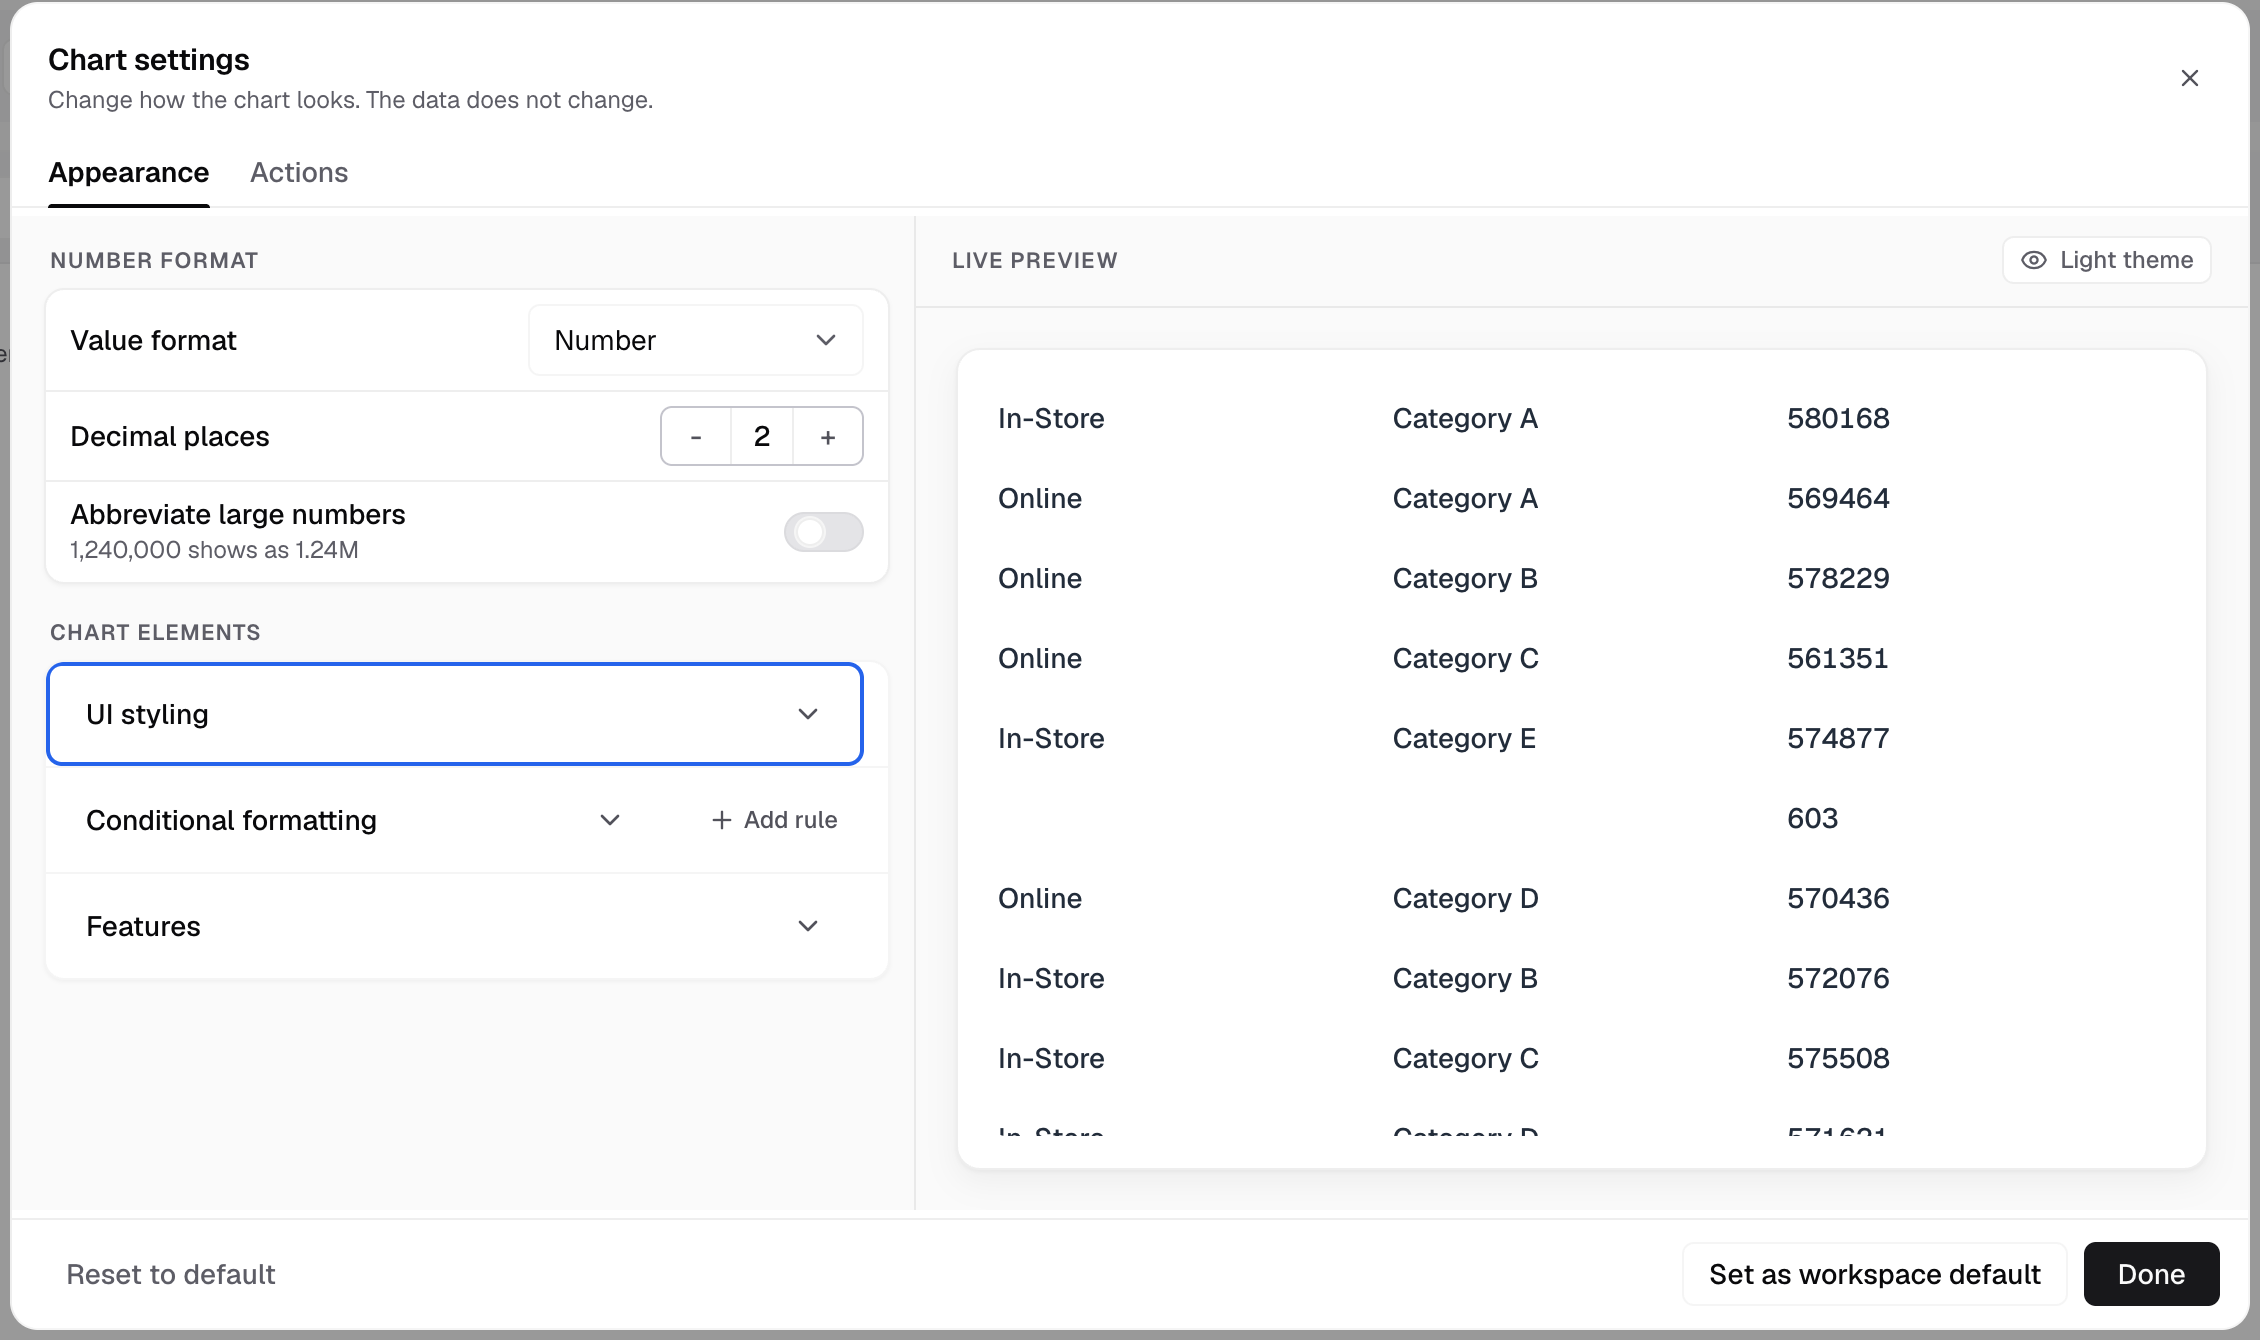
Trend Analyzer has UI styling, Conditional formatting and Features.
Settings for this chart
- UI styling, Conditional formatting and Features are in Chart settings.
- Trend Analyzer draws fewer of these than Table. It has no header sort, search box, paginator or footer row.
For sorting, search and pages, use a table.