

Chart types
Set up a tree map
Show parts of a whole as nested rectangles sized by a measure.
Show each group as a rectangle. A bigger value makes a bigger rectangle.
Before you start
- The metric is grouped: it has at least one dimension and a measure with an aggregate. Tree map does not show until then.
What the data needs
| Dimensions | Measures |
|---|---|
| 1 or more, the groups | 1 or more, with an aggregate. It sets the size. |
Steps
-
Add the group fields to Dimensions, for example
regionandproduct. -
Add one aggregated field to Measures, for example
sum(revenue). -
In the chart toolbar, select Chart type, then Tree map.
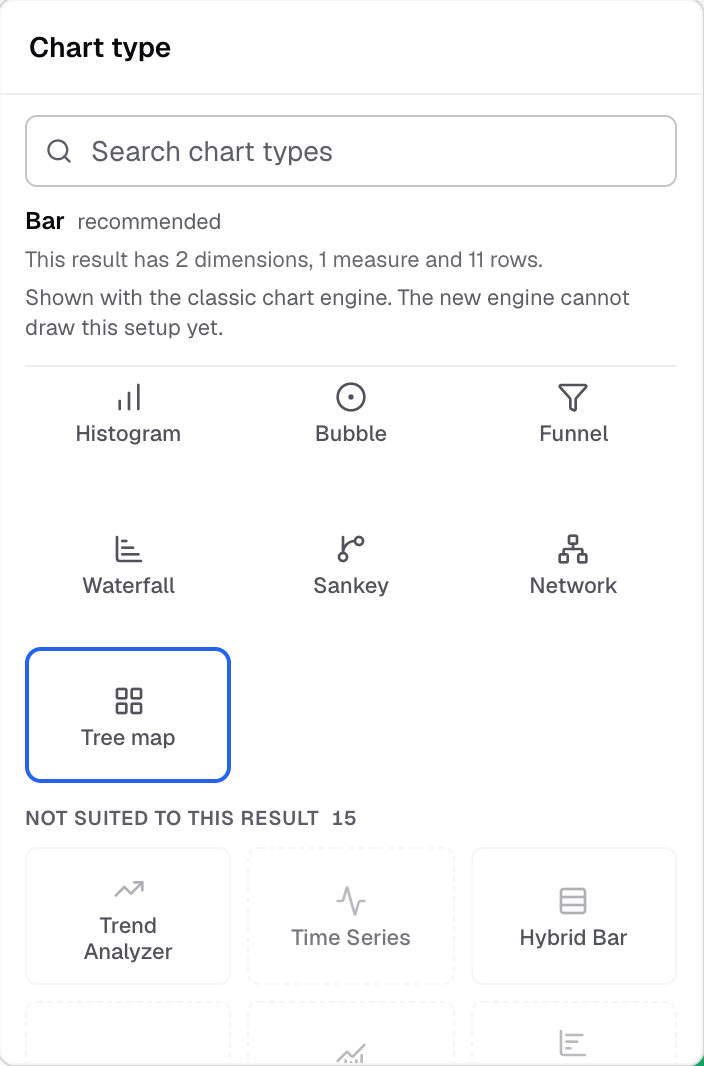
Tree map in the Chart type picker. -
Select Appearance and open Chart colors.
-
Turn on Min, mid and max colors, then set the Min color, Mid color and Max color.
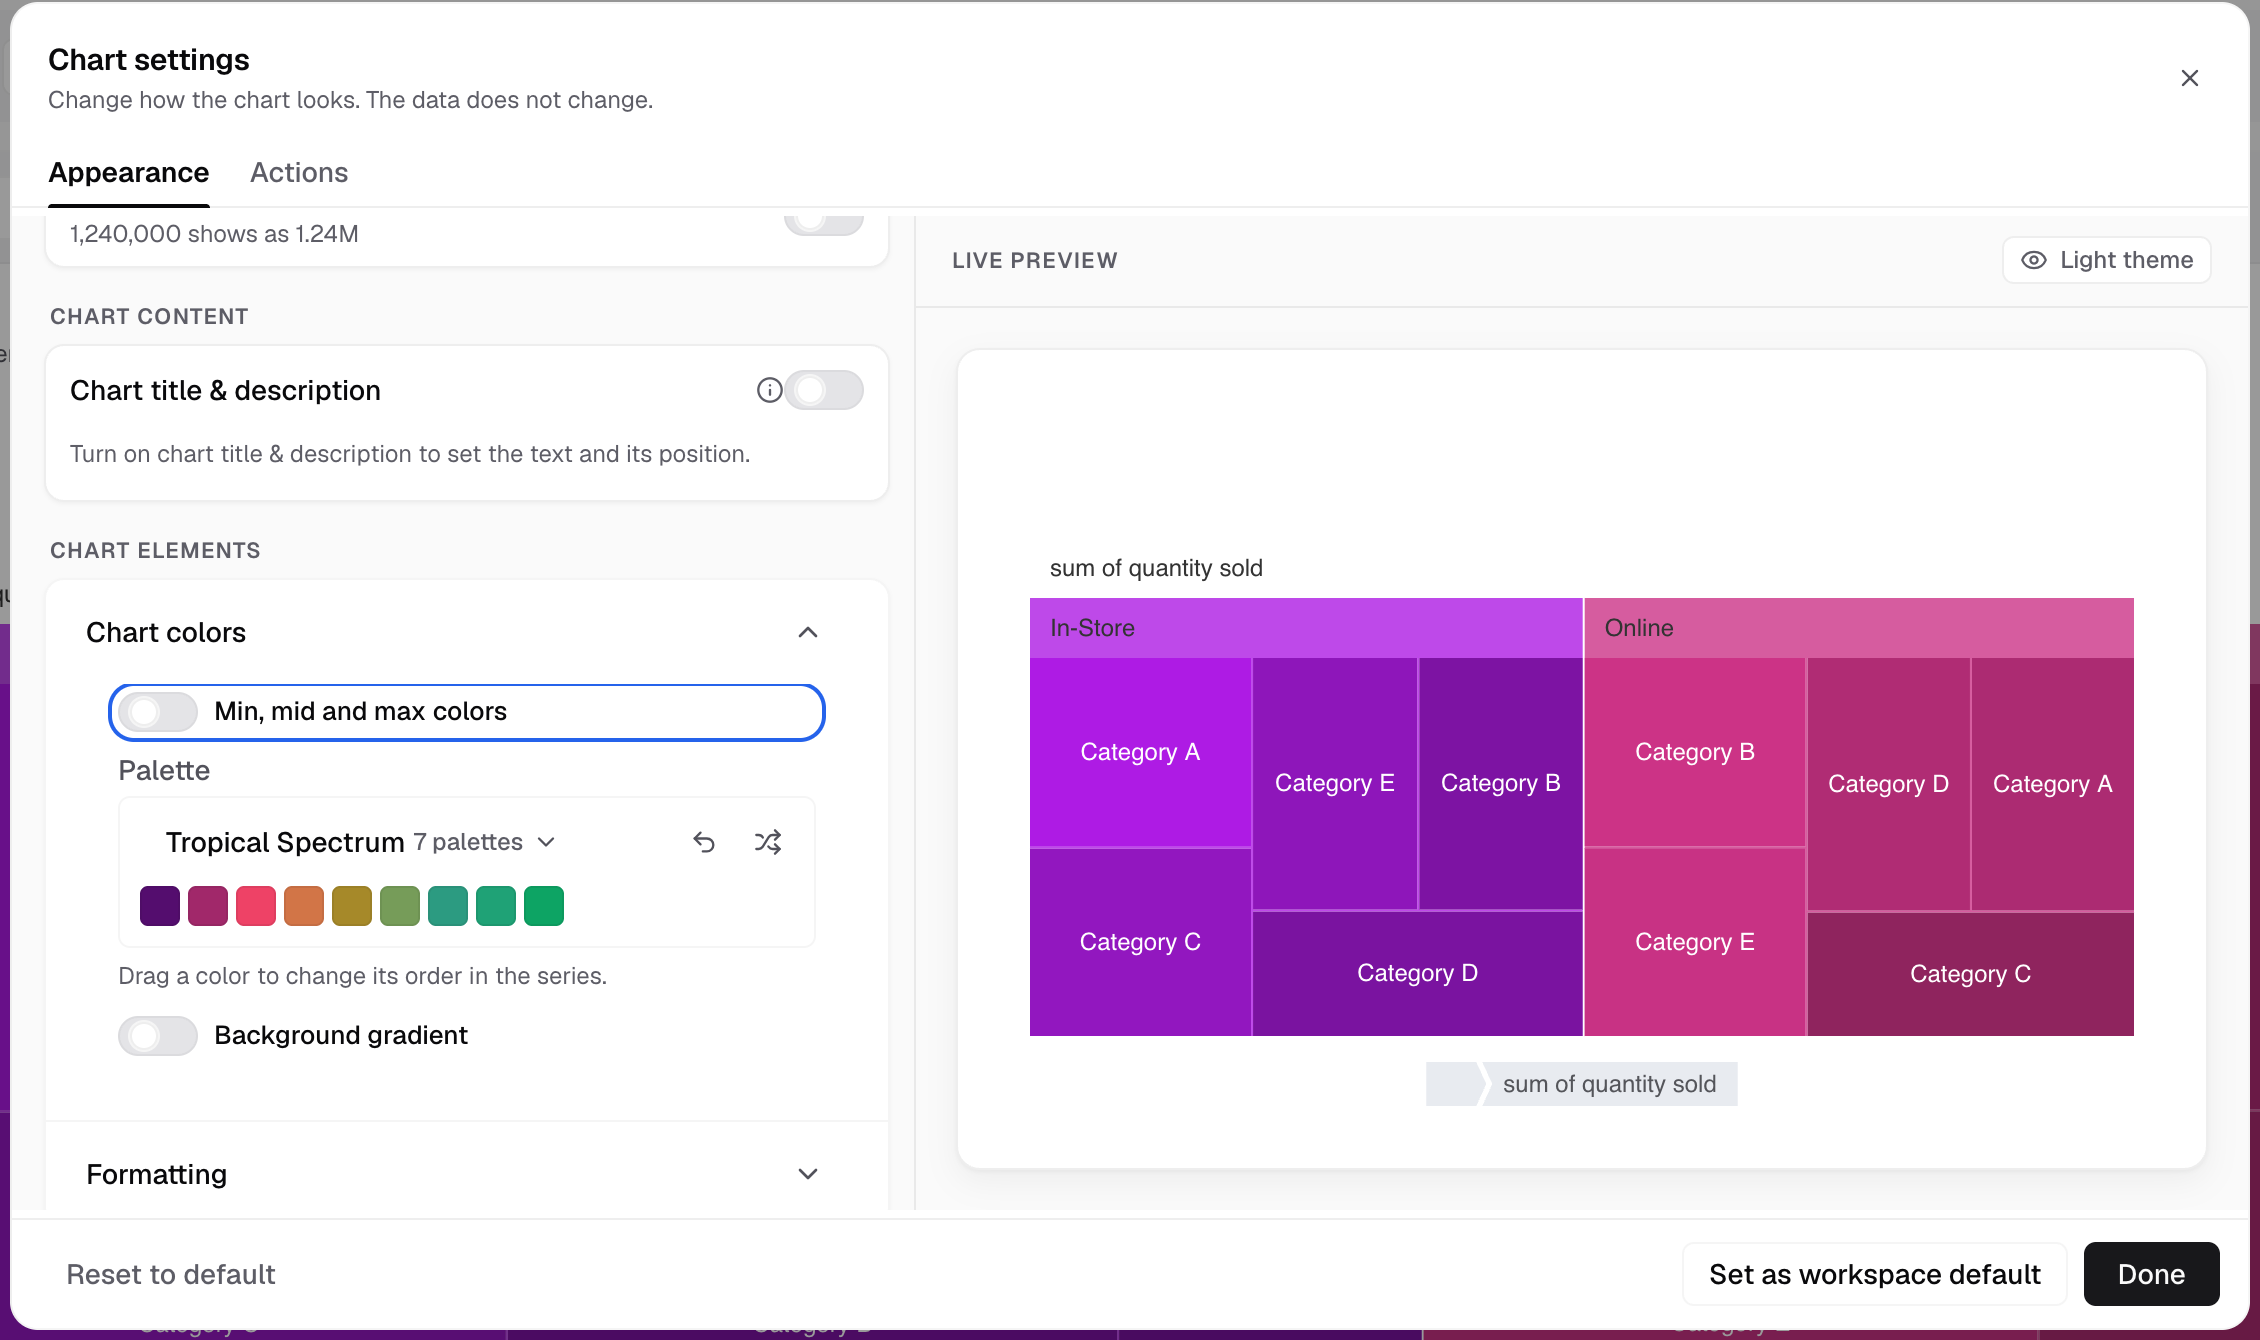
Turn on Min, mid and max colors in Chart colors to set the three colors.
The rectangles take colors from low to high value.
Tree map has no axes, Chart legend, Chart label, Chart margin or Features settings.
Next: change how the chart looks.