

Chart types
Set up a gauge or progress bar
Show one value against a range with a Gauge, Linear Gauge or Progress Bar.
Show how far one value is along a range.
What the data needs
| Chart | Measures |
|---|---|
| Gauge | 1 |
| Linear Gauge | 1, the progress value |
| Progress Bar | 1, the progress value. With 2 measures, the second is the max. With 3, the second is the min and the third is the max. |
Steps
-
Add the value to Measures, for example
sum(revenue). -
In the chart toolbar, select Chart type.
-
Select Gauge, Linear Gauge or Progress Bar.
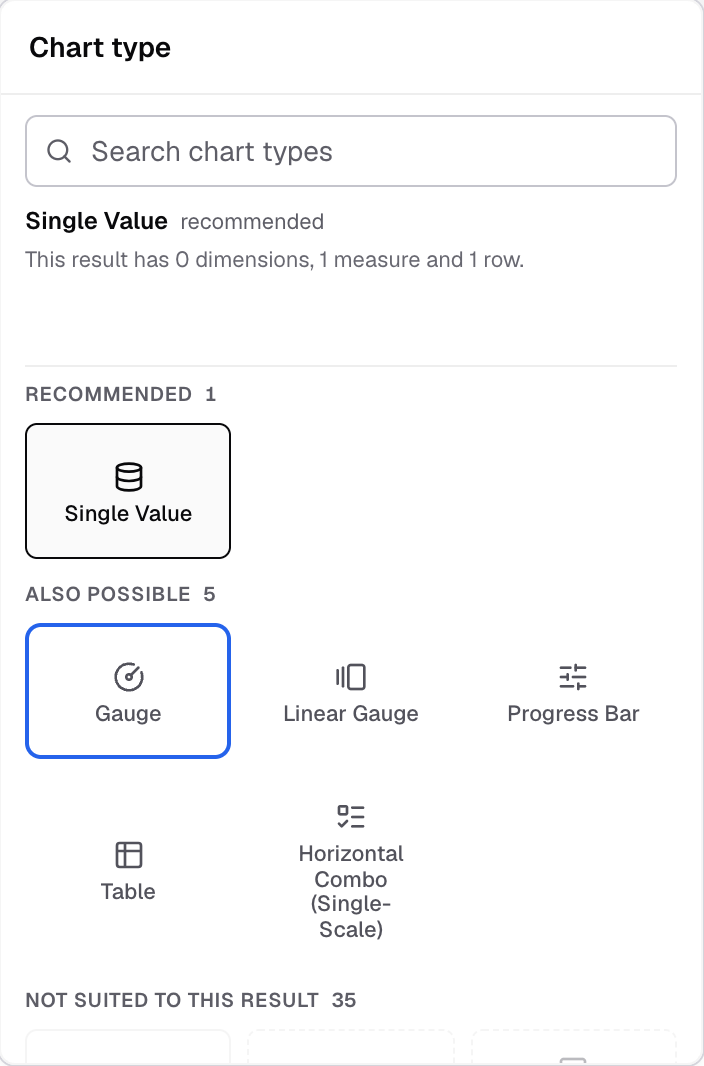
Gauge in the Chart type picker. -
To change how it looks, select Appearance.
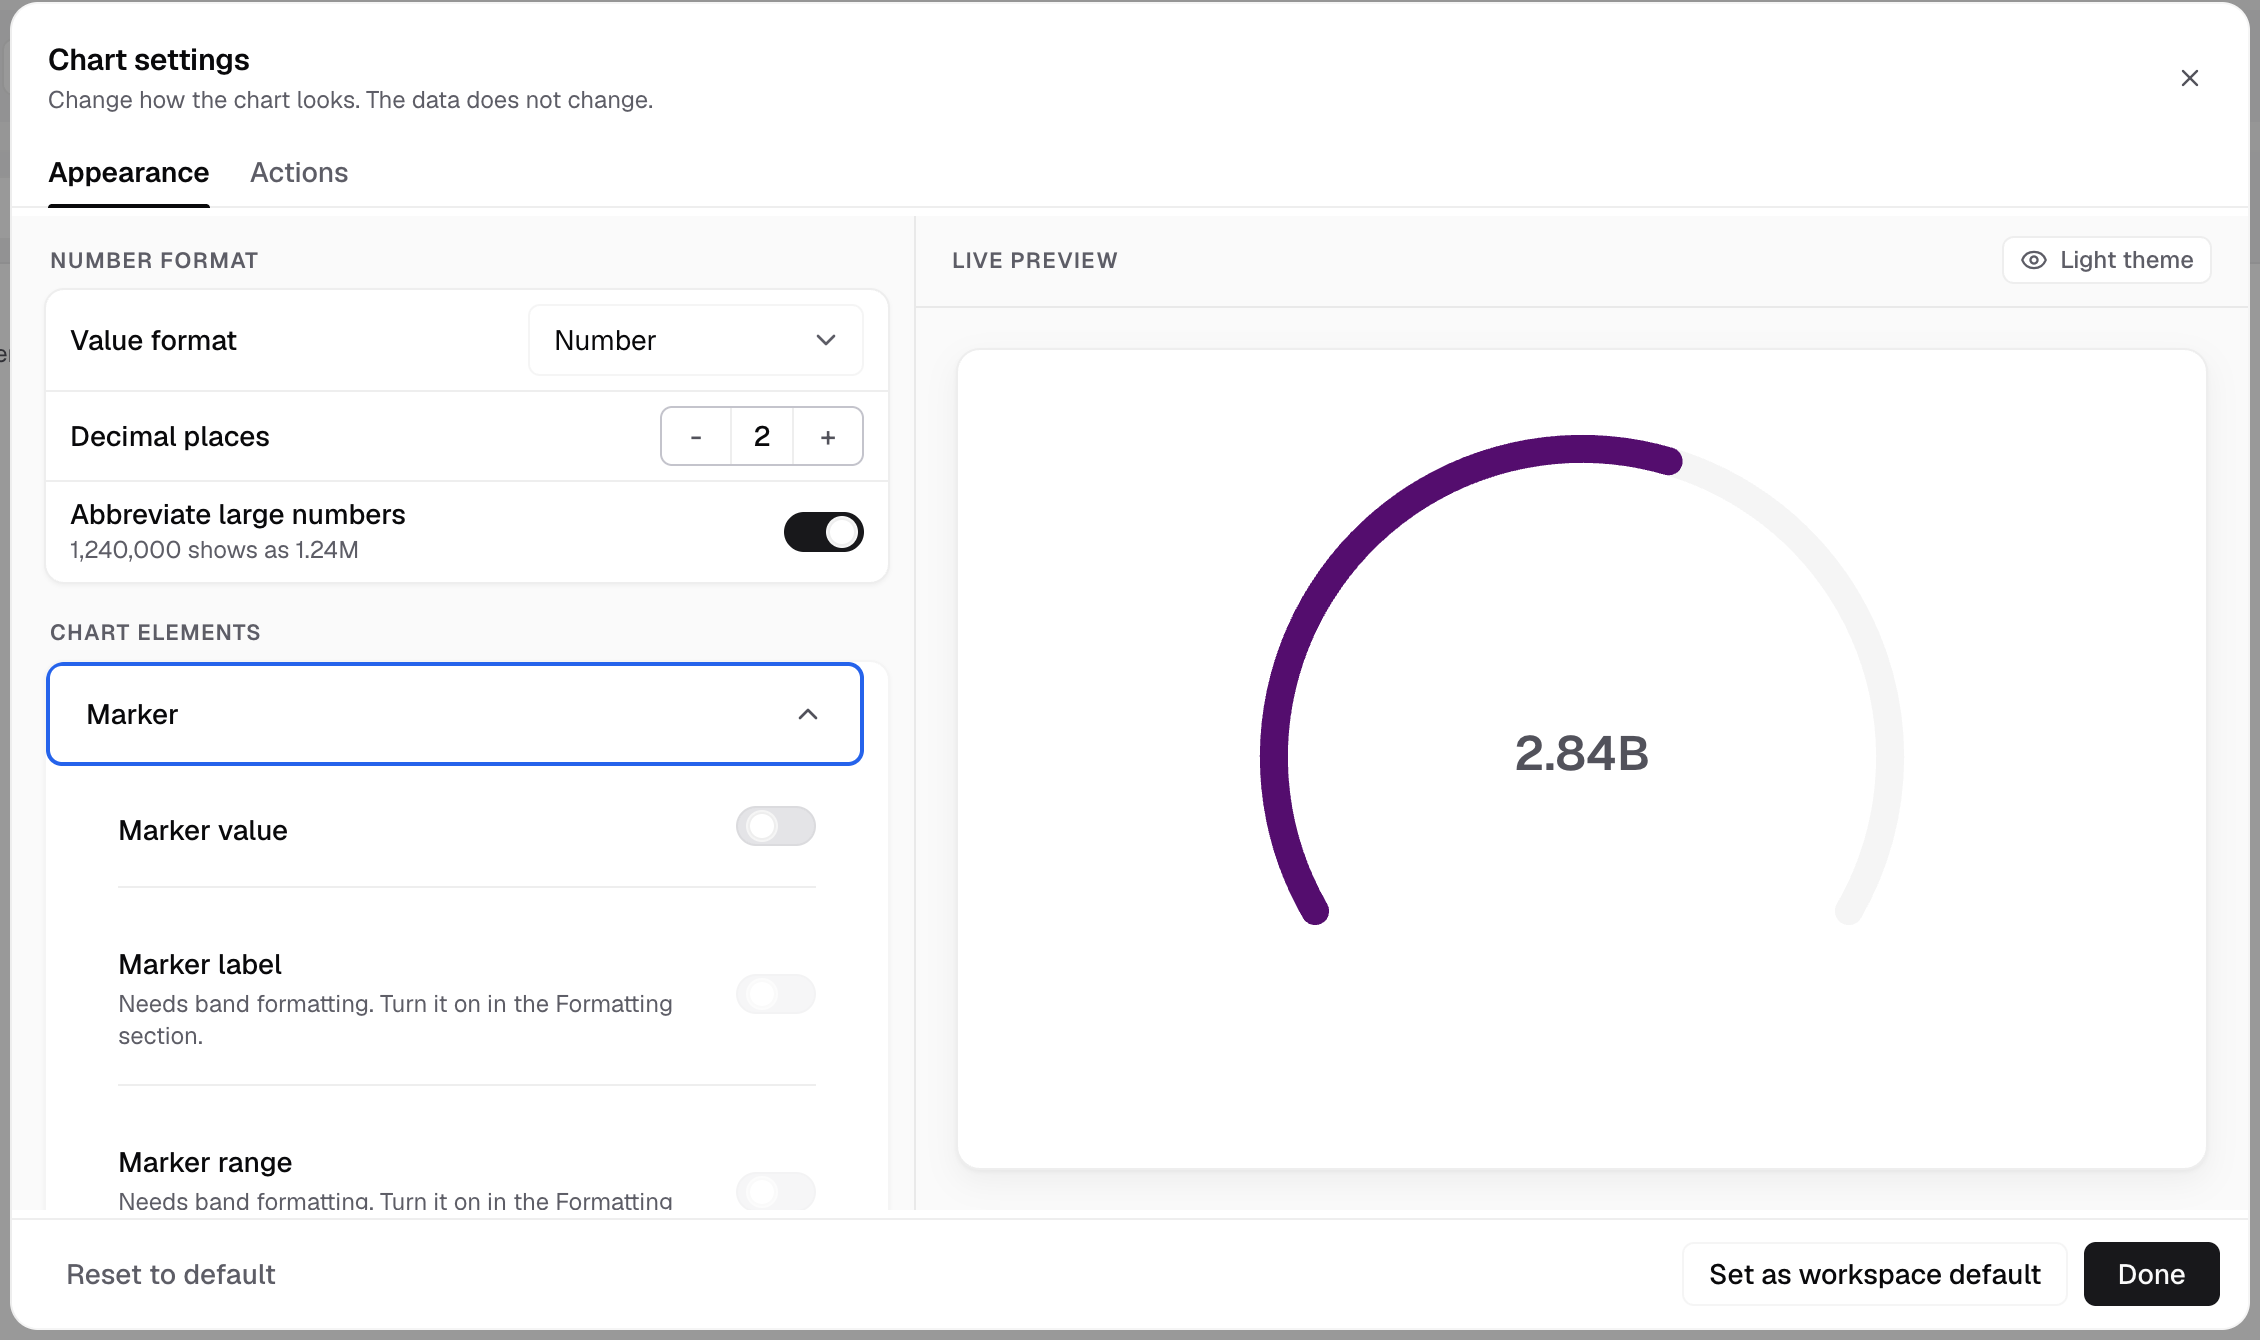
A Gauge has Marker, Legend, Chart colors and Formatting.
Settings for these charts
| Chart | Sections |
|---|---|
| Gauge | Marker (value, label, range, color), Legend, Chart colors, Formatting |
| Linear Gauge | Chart markers, Labels, Legend, Chart colors, Formatting |
| Progress Bar | Chart markers, Labels, Legend, Chart colors, Limits, Formatting |
On a Progress Bar, Limits sets an Upper limit and a Lower limit. Each has a Bar color and an Alert message.
Use Formatting > Band formatting to color value ranges. On a Gauge, band formatting also sets the marker colors.
The Actions tab is greyed out for these charts.
For a plain number, use Single Value.