

Chart types
Set up a scatter, bubble or radar chart
Compare measures against each other with a Scatter, Bubble or Radar chart.
Show how values relate to each other. This page covers Scatter, Bubble and Radar.
What the data needs
| Chart | Dimensions | Measures |
|---|---|---|
| Scatter | 1, the x axis | 2 or more |
| Bubble | 2: the first is x, the second is y | 1 or more. The first measure sets the bubble size. |
| Radar | 1. Each value is a point on the web. | 3 or more. Each measure is a spoke. |
Set up a scatter chart
-
Add the x axis field to Dimensions.
-
Add two or more fields to Measures.
-
In the chart toolbar, select Chart type, then Scatter.
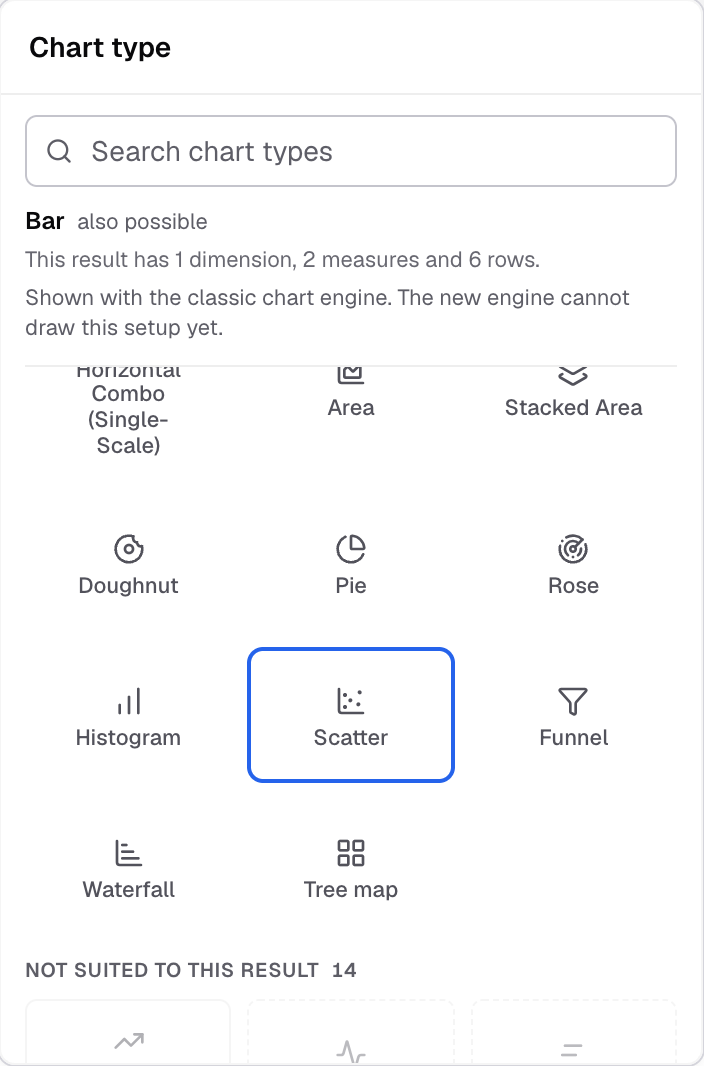
Scatter in the Chart type picker.
Set up a bubble chart
- Add the x field to Dimensions, for example
deal_count. - Add the y field to Dimensions as the second dimension, for example
win_rate. - Add the size field to Measures, for example
pipeline. - In the chart toolbar, select Chart type, then Bubble.
Each row is one bubble. Its position comes from the two dimensions, and its size from the measure.
Set up a radar chart
- Add the category field to Dimensions, for example
team. - Add three or more fields to Measures, for example
speed,qualityandcost. - In the chart toolbar, select Chart type, then Radar.
Settings for these charts
-
Horizontal axis and Vertical axis set axis names, labels and limits.
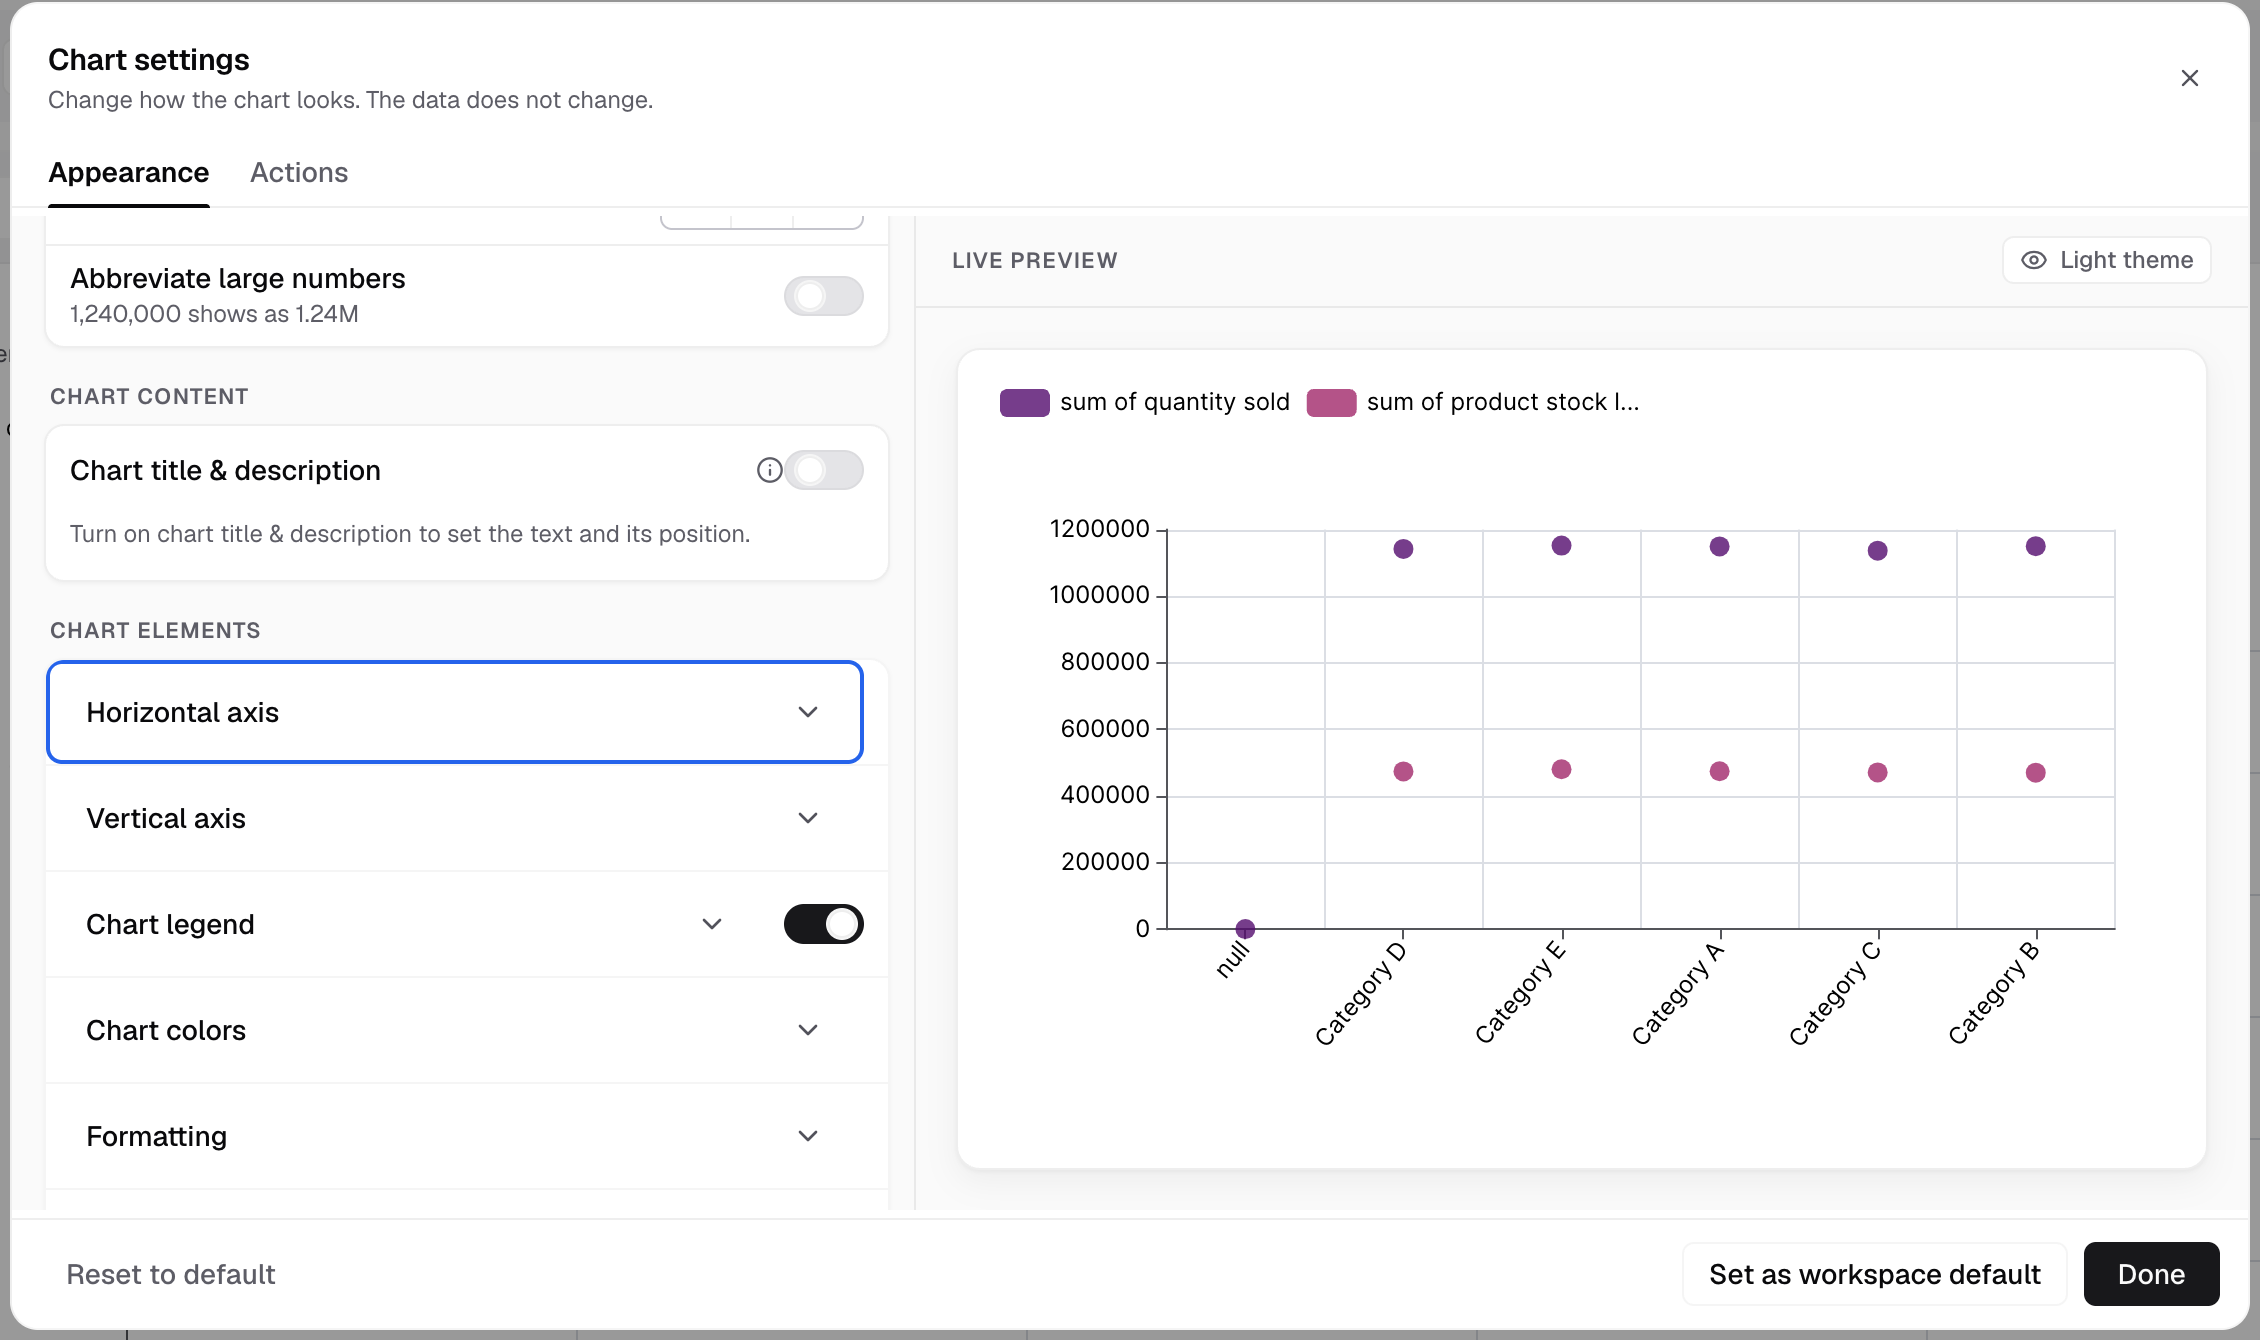
Horizontal axis and Vertical axis are under Chart elements. -
Scatter and Bubble have no Chart markers section.
-
Features has Limit data points and Chart zoom for Scatter.
If something goes wrong
- Bubble is under “Not suited to this result”. The metric has one dimension. Add a second dimension for y.
- Radar is under “Not suited to this result”. Add measures until there are three or more.
Next: change how the chart looks.