

Chart types
Set up a funnel, sankey or waterfall chart
Show drop-off between steps, flow between groups, or how a total changes.
Show how a value moves. Funnel shows drop-off between steps. Sankey shows flow from one group to another. Waterfall shows the ups and downs that make a total.
What the data needs
| Chart | Dimensions | Measures |
|---|---|---|
| Funnel | 1, the step | Exactly 1 |
| Sankey | 2: source, then target | 1, the value of the flow |
| Waterfall | 1, the x axis | Exactly 1. Negative values show as decreases. |
Set up a funnel
-
Add the step field to Dimensions, for example
stage. -
Add one field to Measures, for example
count(users). -
In the chart toolbar, select Chart type, then Funnel.
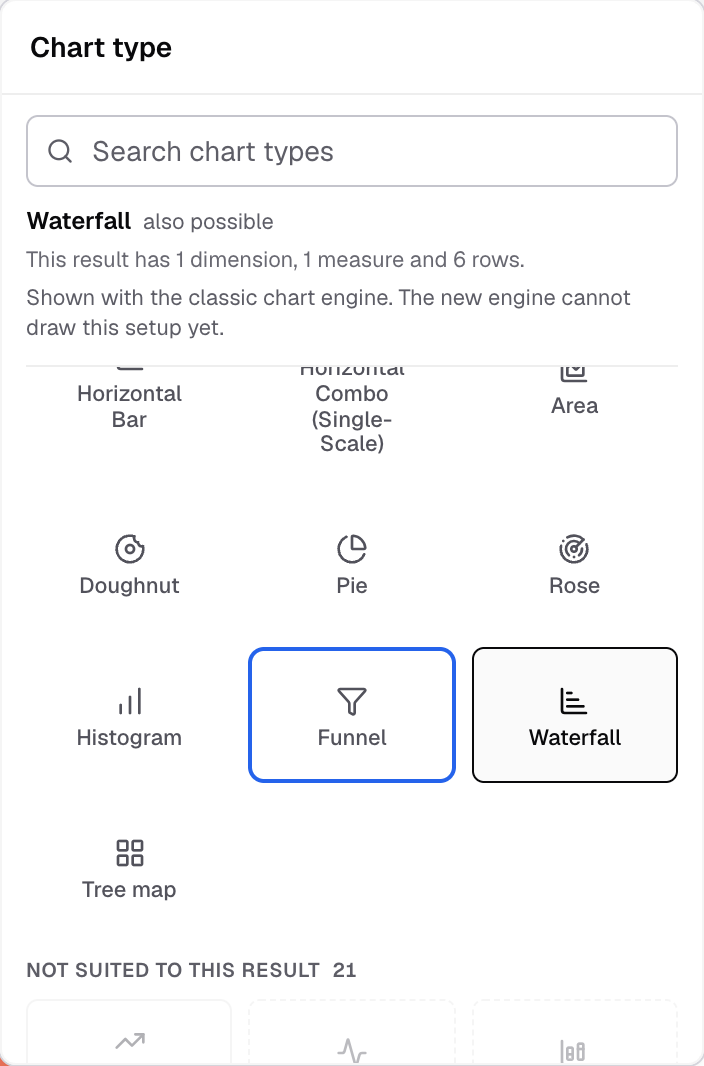
Funnel in the Chart type picker.
Funnel has no chart settings panel. Appearance is greyed out for it.
Set up a sankey
-
Add the source field to Dimensions, for example
from_page. -
Add the target field to Dimensions as the second dimension, for example
to_page. -
Add the value to Measures, for example
count(sessions). -
In the chart toolbar, select Chart type, then Sankey.
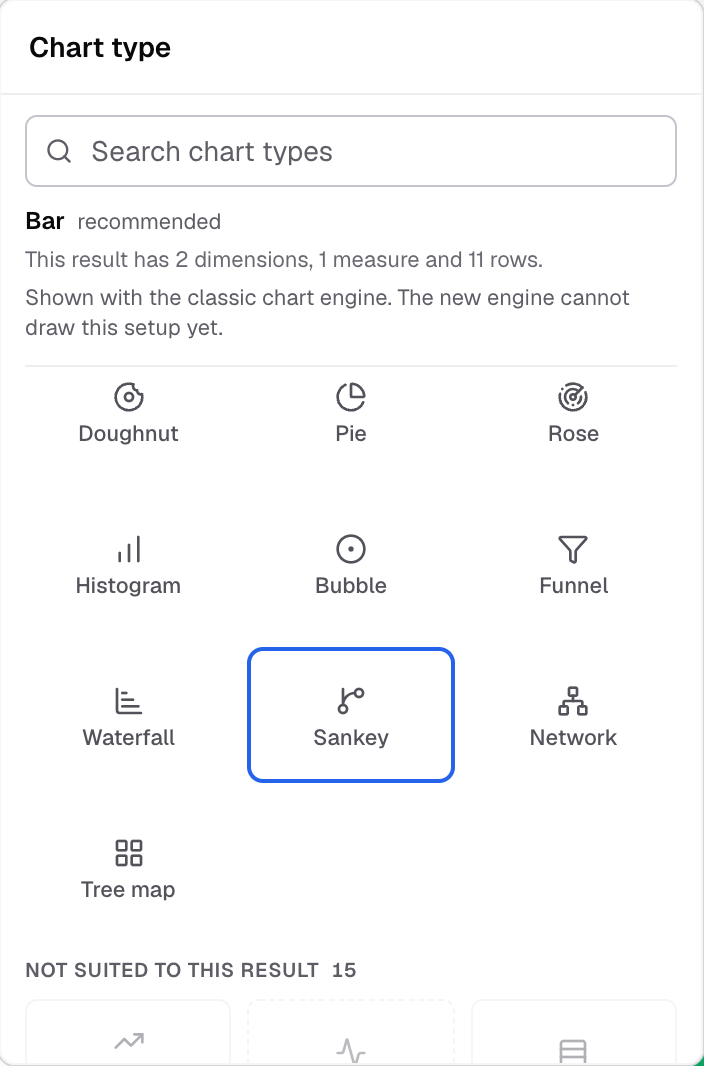
Sankey in the Chart type picker. -
To flip the direction, select Appearance, open Features and turn on Swap source and target.
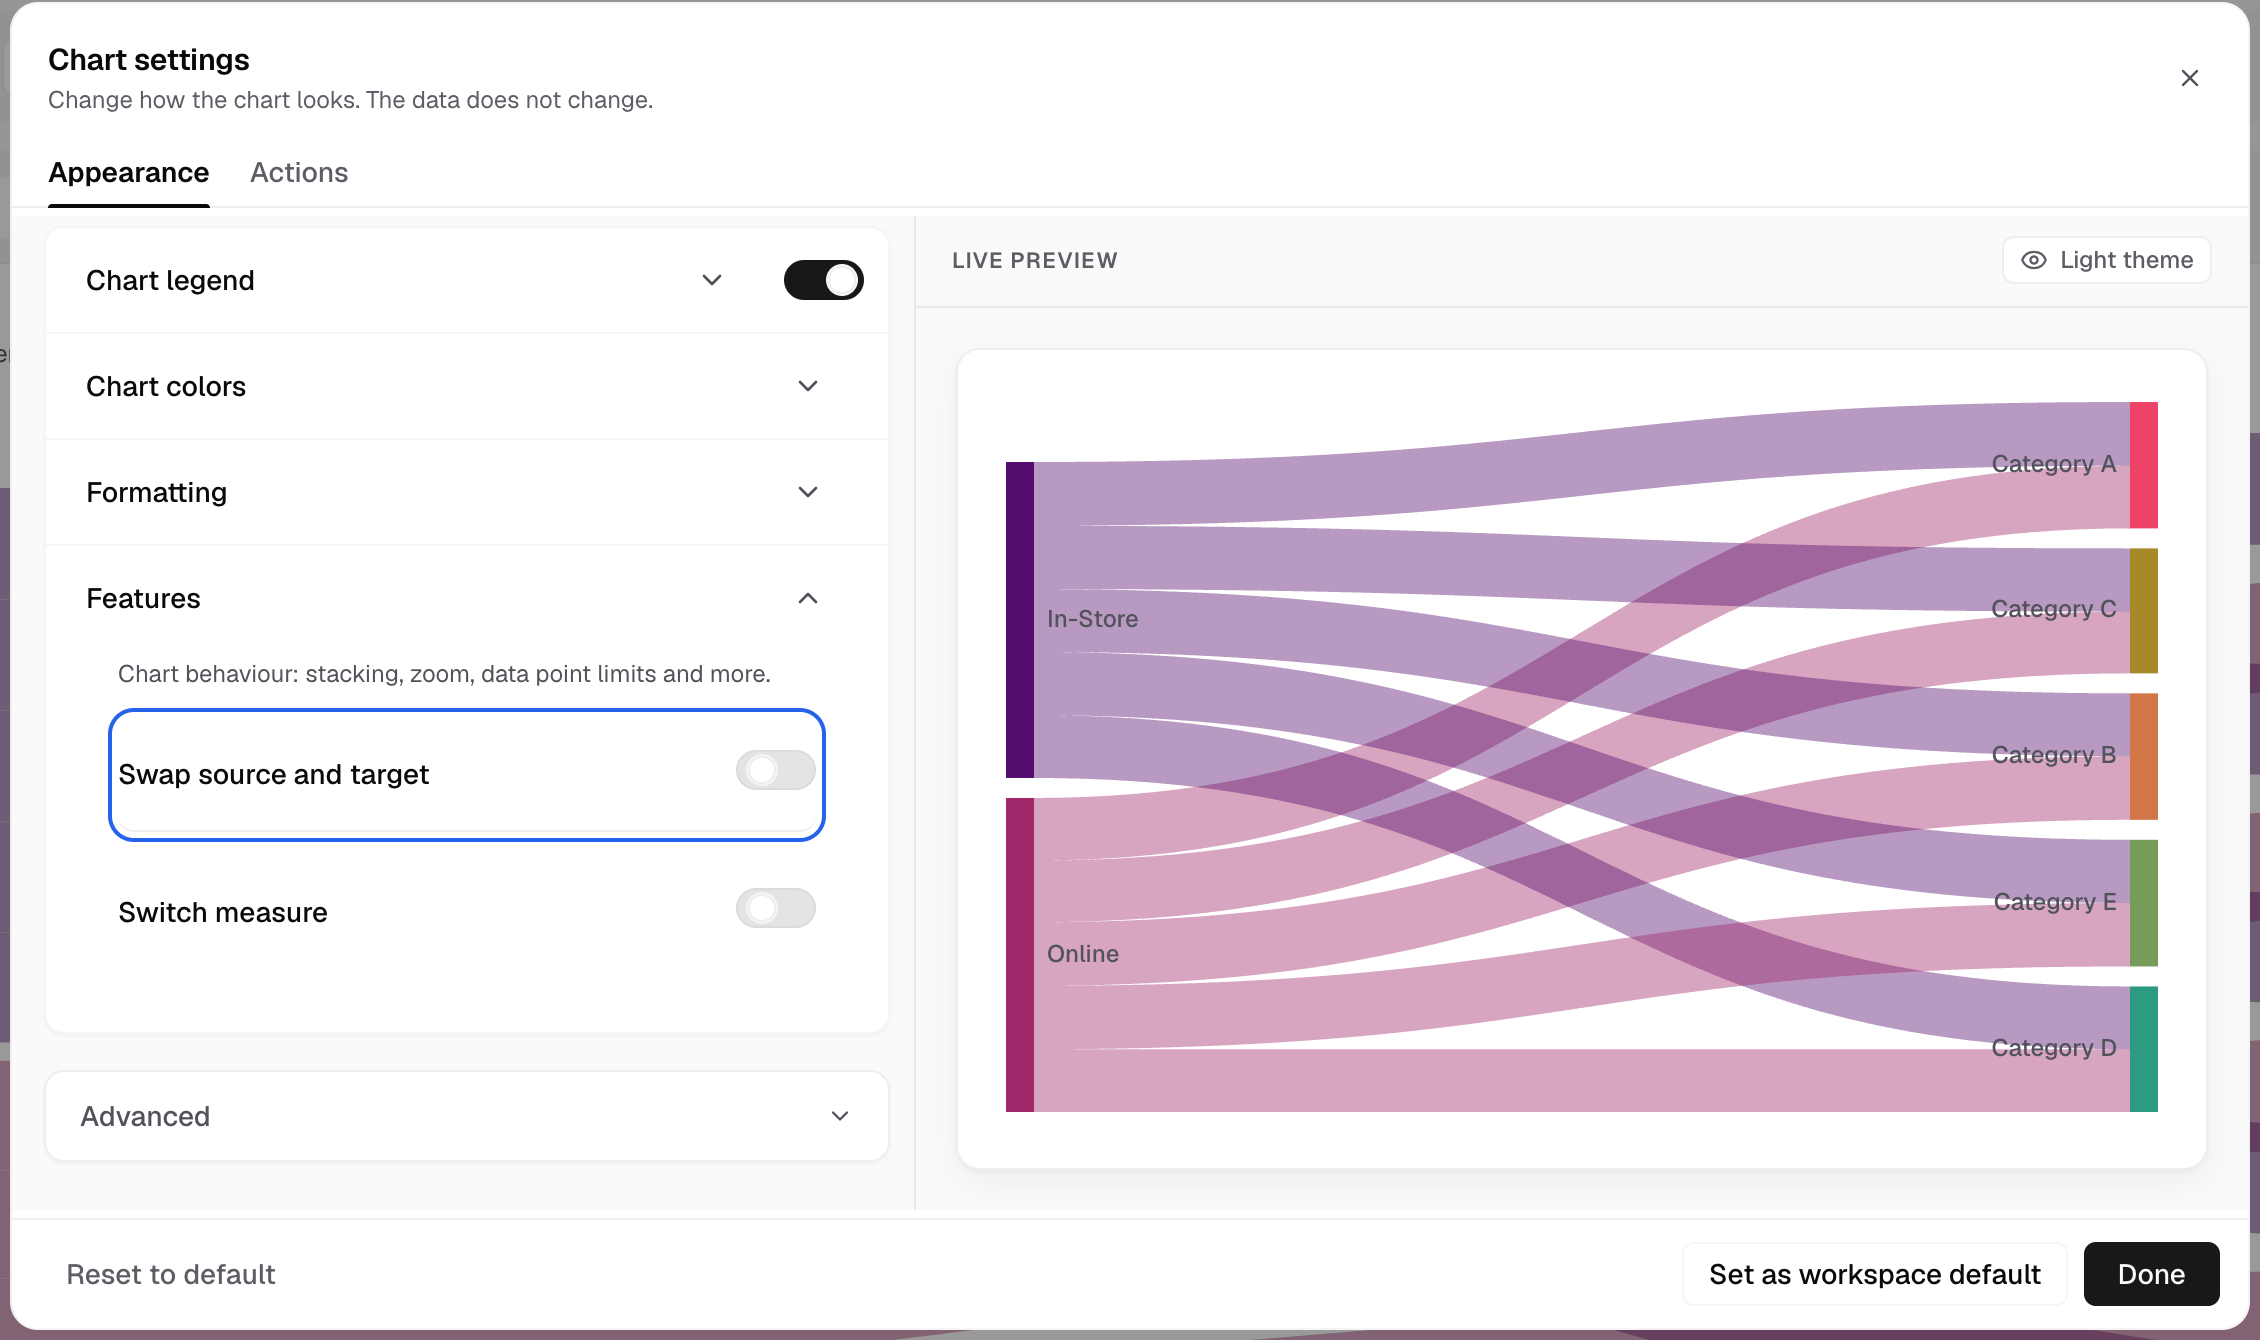
Swap source and target is in Features.
Set up a waterfall
-
Add the x axis field to Dimensions, for example
month. -
Add one field to Measures, for example
net_change. -
In the chart toolbar, select Chart type, then Waterfall.
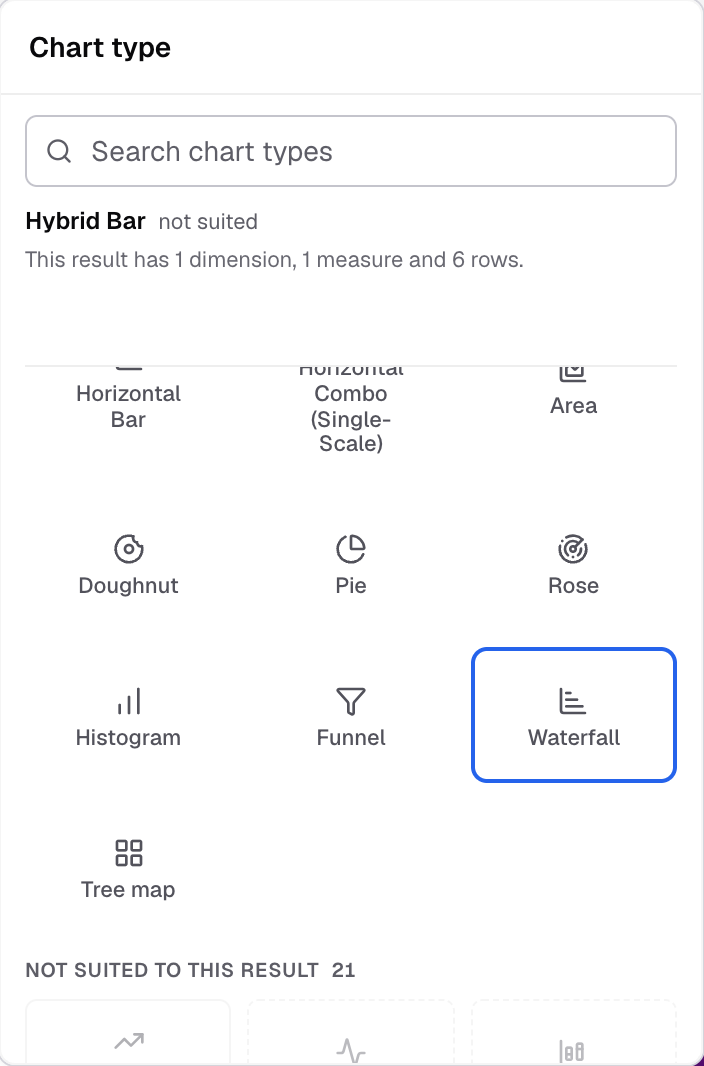
Waterfall in the Chart type picker. -
Select Appearance, then open Waterfall settings.
-
To add a total bar, turn on Total column.
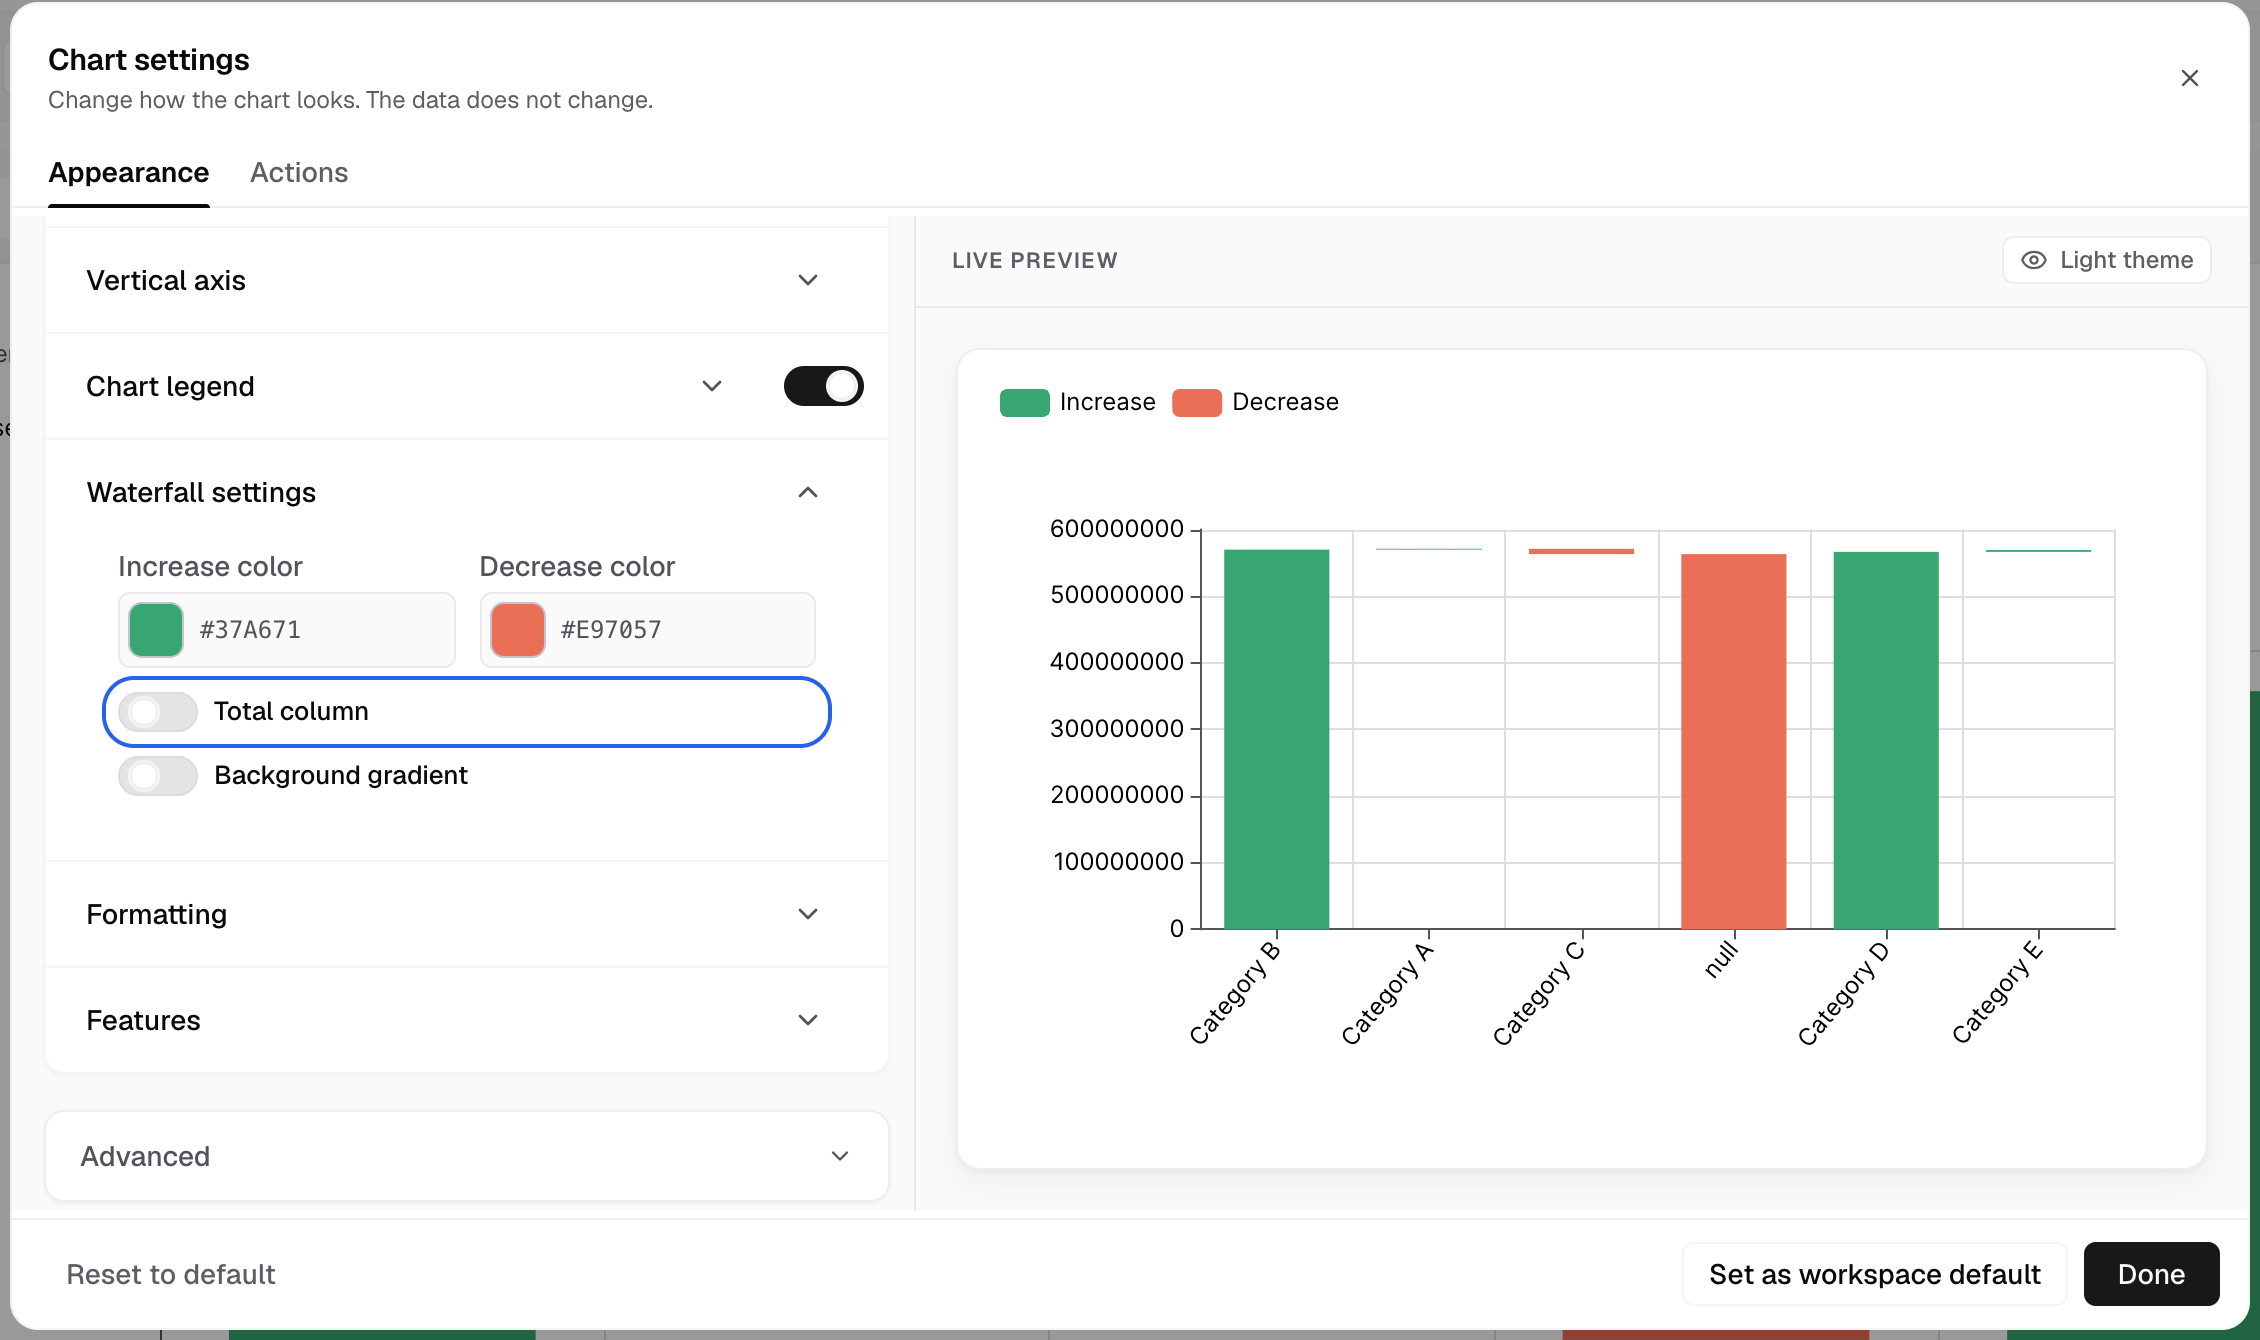
Total column is in Waterfall settings.
Waterfall settings also sets Increase color, Decrease color, and a Lower limit and Upper limit.
For a node graph with the same data, see Network.