

Chart types
Set up a boxplot
Show the spread of values per category from five summary measures.
Show the minimum, quartiles, median and maximum for each category. Your query computes the five values.
What the data needs
| Dimensions | Measures |
|---|---|
1, for example region | Exactly 5, in this order: min, q1, median, q3, max |
Steps
-
Add the category field to Dimensions.
-
Add the five measures to Measures in this order: min, q1, median, q3, max.
-
In the chart toolbar, select Chart type, then BoxPlot.
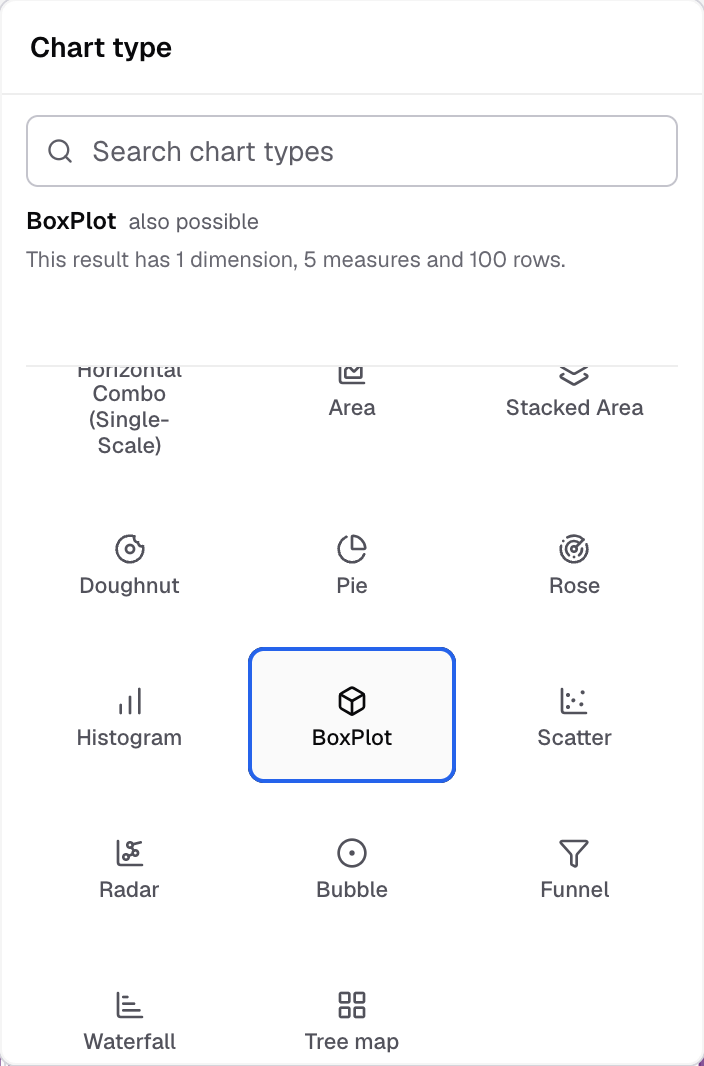
BoxPlot in the Chart type picker. -
To change how it looks, select Appearance.
The chart shows one box for each category.
Settings for this chart
- Horizontal axis and Vertical axis set axis names, labels and limits.
- BoxPlot has no Chart markers, Chart legend or Chart label settings.
- Drill down and Chart Click Actions do not work on a BoxPlot.
If something goes wrong
- BoxPlot does nothing when you select it. The metric has fewer than five measures. Add all five.
Next: change how the chart looks.