

Chart types
Set up a pie, doughnut or rose chart
Show how parts make up a whole with a Pie, Doughnut or Rose chart.
Show each category’s share of one measure.
What the data needs
| Dimensions | Measures |
|---|---|
| 1. Each value is a slice. | Exactly 1. It sets the slice size. |
Steps
-
Add the category field to Dimensions, for example
channel. -
Add one field to Measures, for example
pipeline. -
In the chart toolbar, select Chart type.
-
Select Pie, Doughnut or Rose.
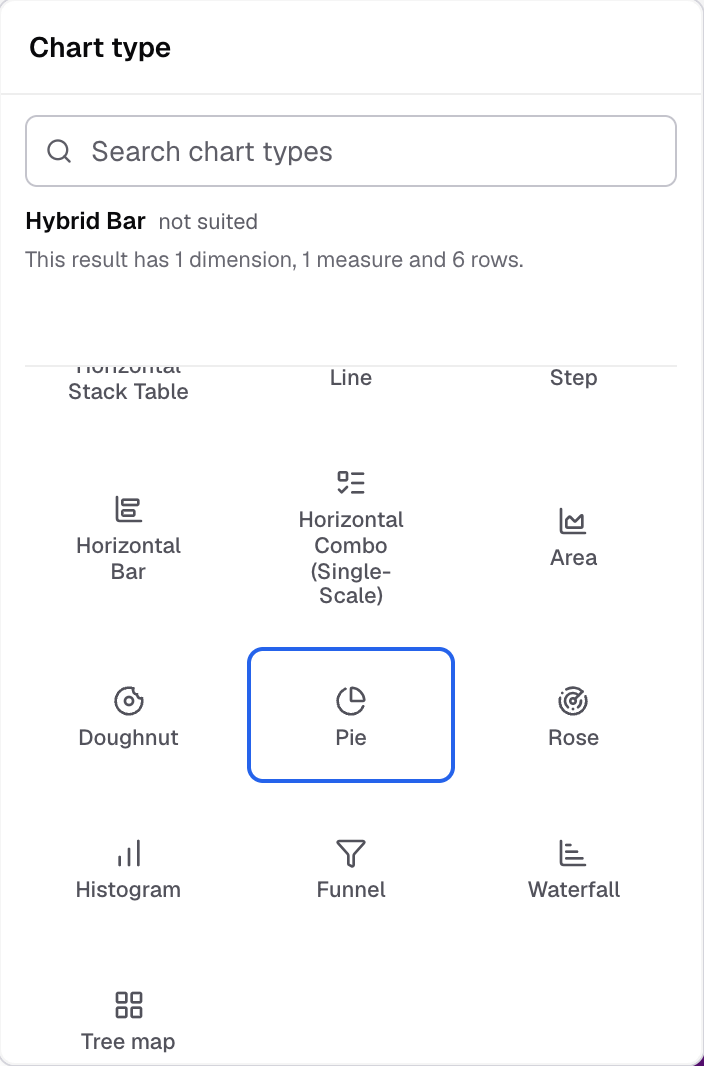
Pie in the Chart type picker. -
To change how it looks, select Appearance.
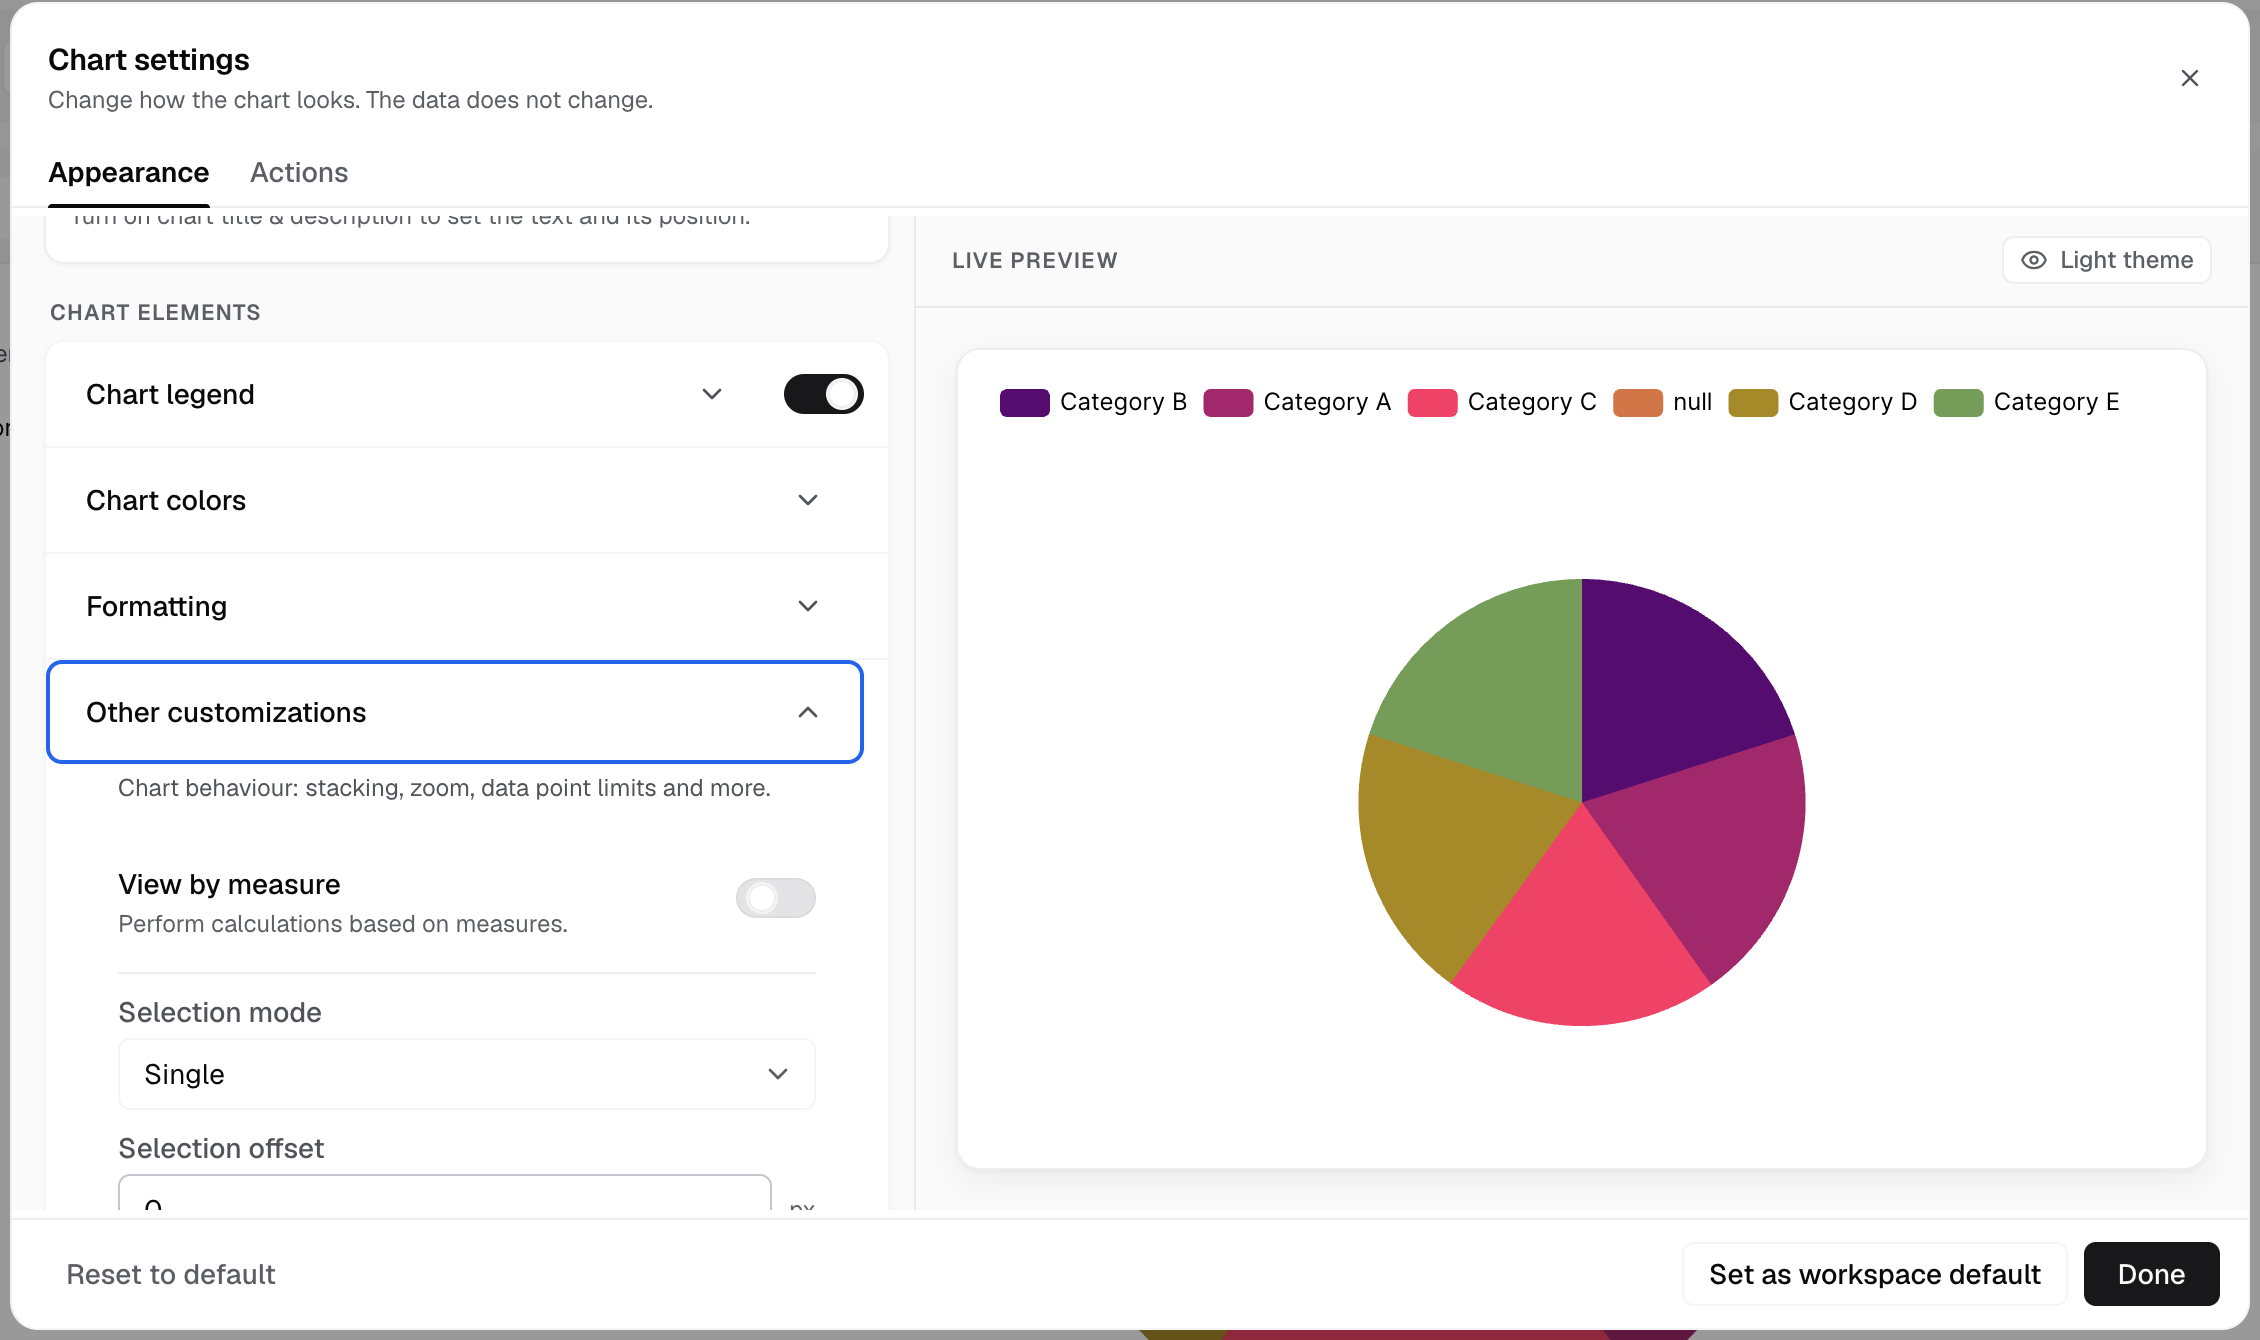
Other customizations holds View by measure, Selection mode and Selection offset.
The chart shows one slice for each category.
Settings for this chart
- Other customizations: View by measure. Pie and Rose also have Selection mode (Single, Multiple, Series) and Selection offset.
- Rose type (Rose only): Radius or Area.
- Advanced > Chart label: Label position, Show dimension label, Show label line, Dynamic label position, Show actual value label.
- Chart legend and Chart colors work as on other charts.
These charts have no axes, no Chart margin and no Chart tooltip settings.
If something goes wrong
- Pie is under “Not suited to this result”. The metric has more than one measure. Keep one measure.
Next: change how the chart looks.