

Chart types
Set up a hybrid bar chart
Show several measures as bars and stack the ones you choose.
Show several measures as bars, and stack the ones you choose.
Before you start
- The metric is grouped: it has at least one dimension and a measure with an aggregate. Hybrid Bar does not show until then.
What the data needs
| Dimensions | Measures |
|---|---|
| 1, the x axis | 2 or more, with an aggregate |
Steps
-
Add the x axis field to Dimensions, for example
month. -
Add two or more fields to Measures, for example
sum(new_revenue)andsum(renewals). -
In the chart toolbar, select Chart type, then Hybrid Bar.
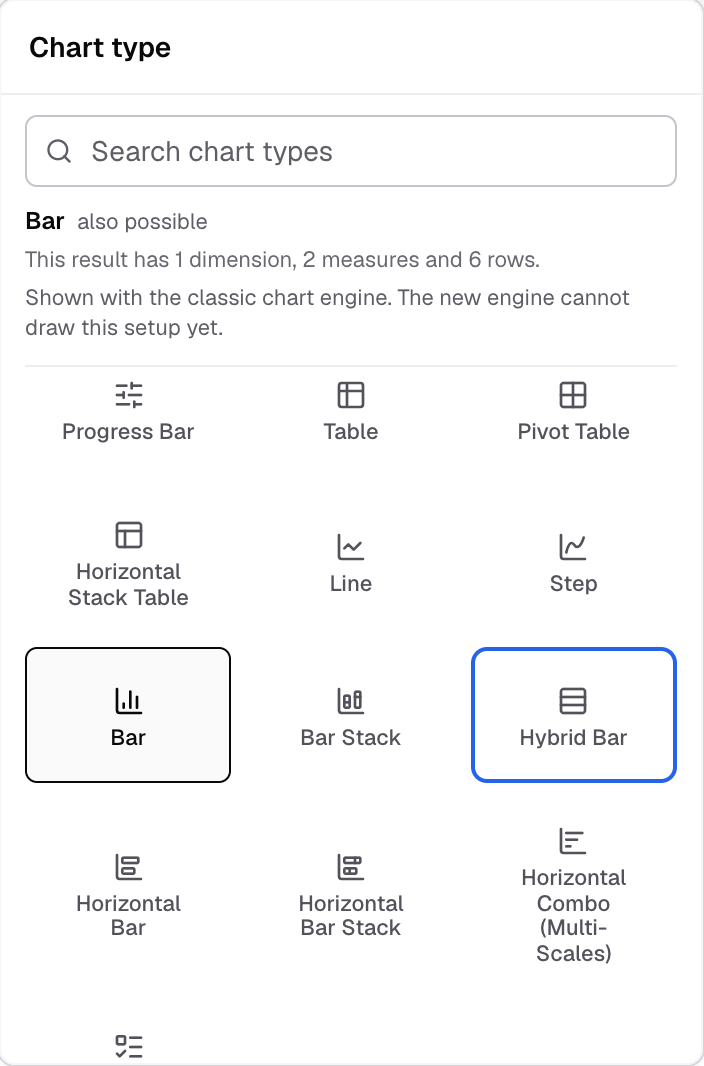
Hybrid Bar in the Chart type picker. -
Above the chart, select Add filter > Group By.
-
Choose the Series Column.
-
In Stack Measures, choose the measures to stack.
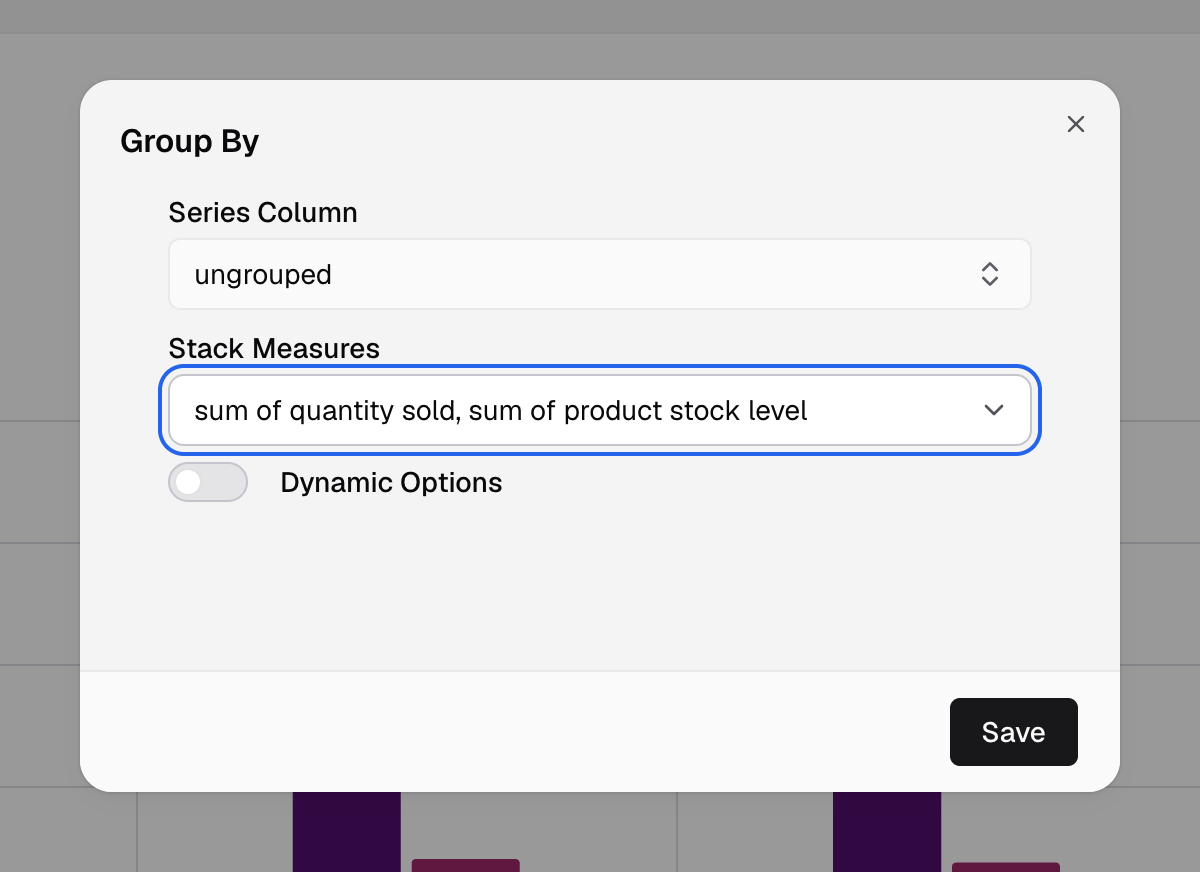
Stack Measures sets which measures stack in one bar.
The chosen measures stack in one bar. Group By
Settings for this chart
- Features has Limit data points and Chart zoom.
- Drill down does not work on a Hybrid Bar.
Next: change how the chart looks.