

Chart types
Set up a single value card
Show one headline number, with a comparison, color rules and a sub-header.
Show one number on a card, for example total revenue.
What the data needs
One column. Databrain uses the first measure, or the first dimension if there is no measure. The card shows the first row only, so make the query return one row.
Steps
-
Add one field to Measures, for example
sum(revenue). -
In the chart toolbar, select Chart type, then Single Value.
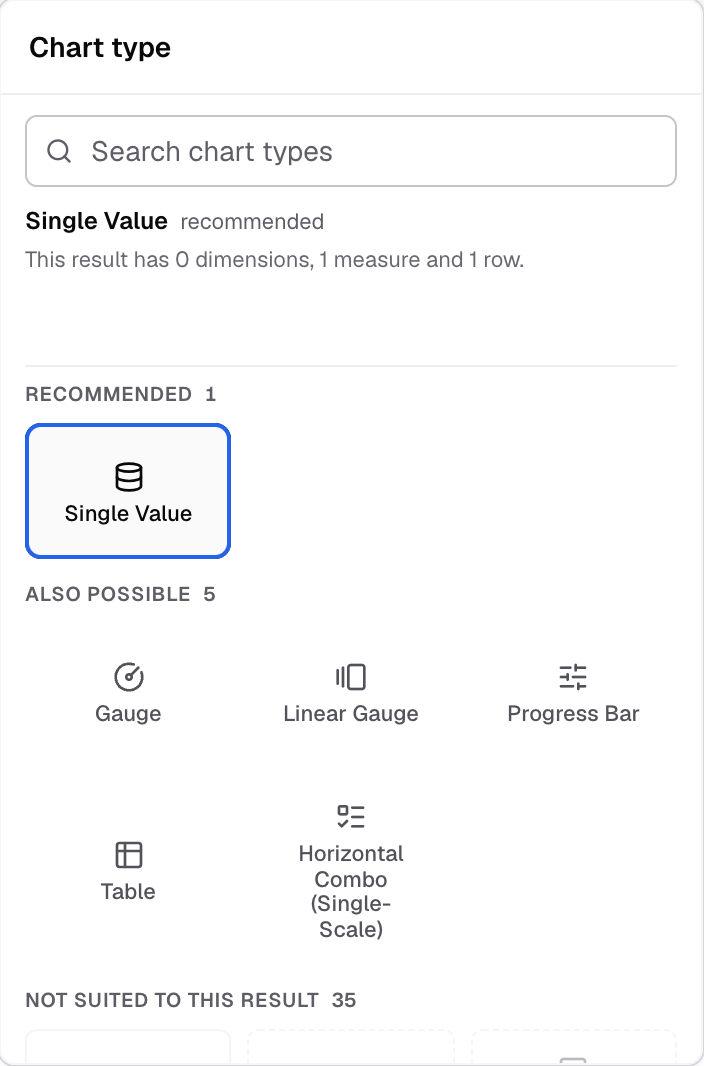
Single Value in the Chart type picker. -
Select Appearance.
-
In Number format, set Value format and Decimal places.
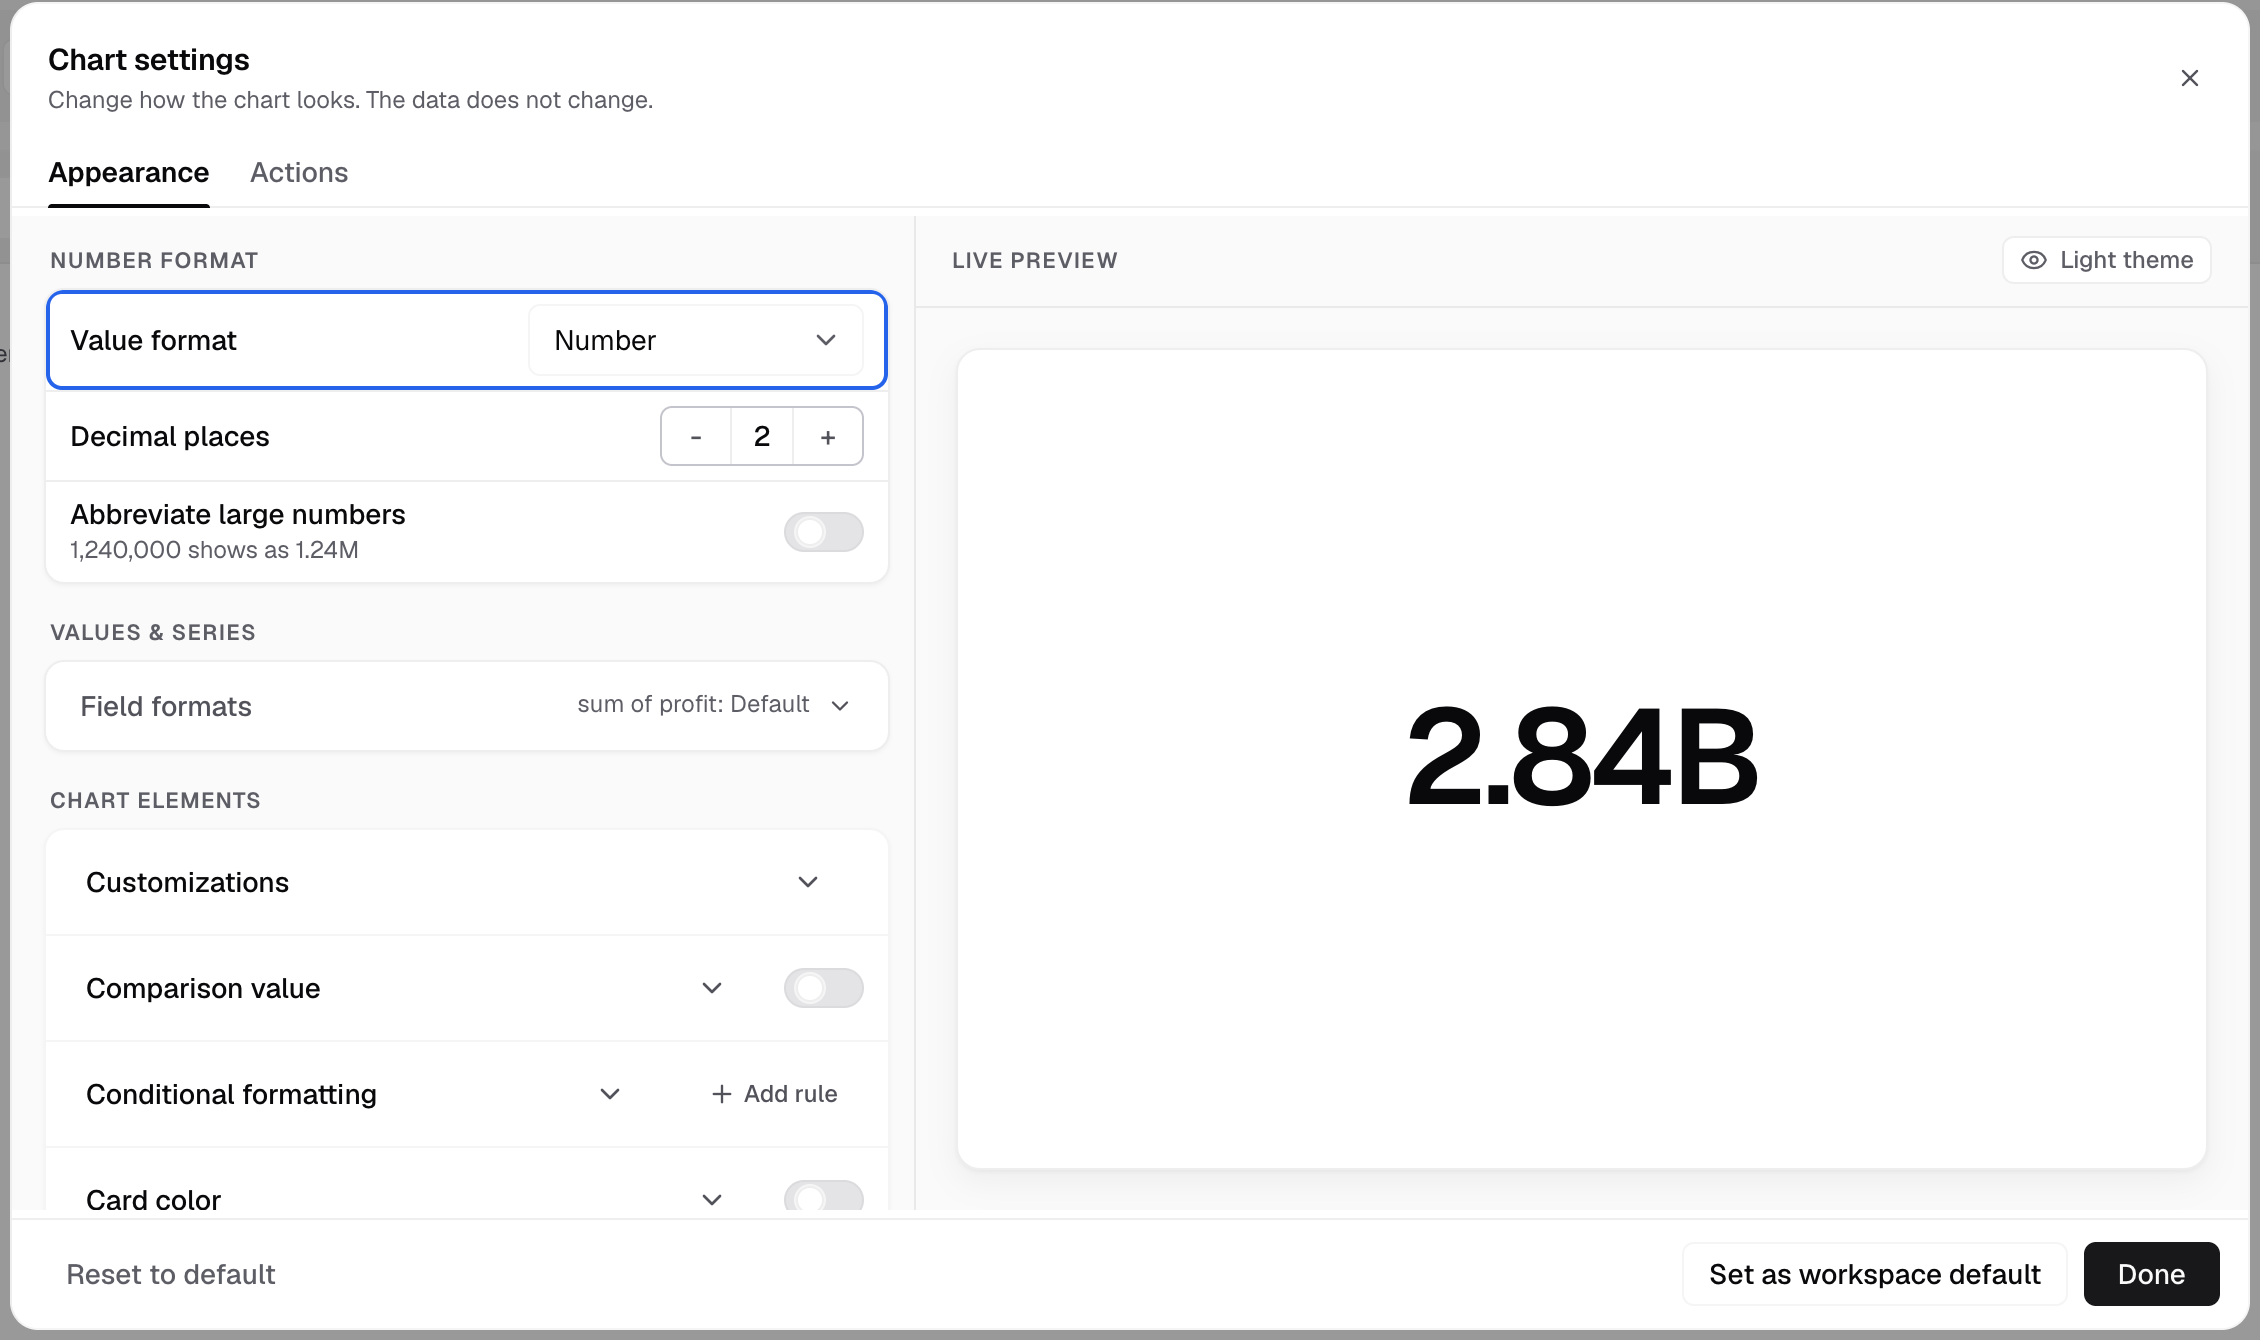
Value format is at the top of Chart settings. -
Open Customizations and set the Prefix, Suffix and Max font size.
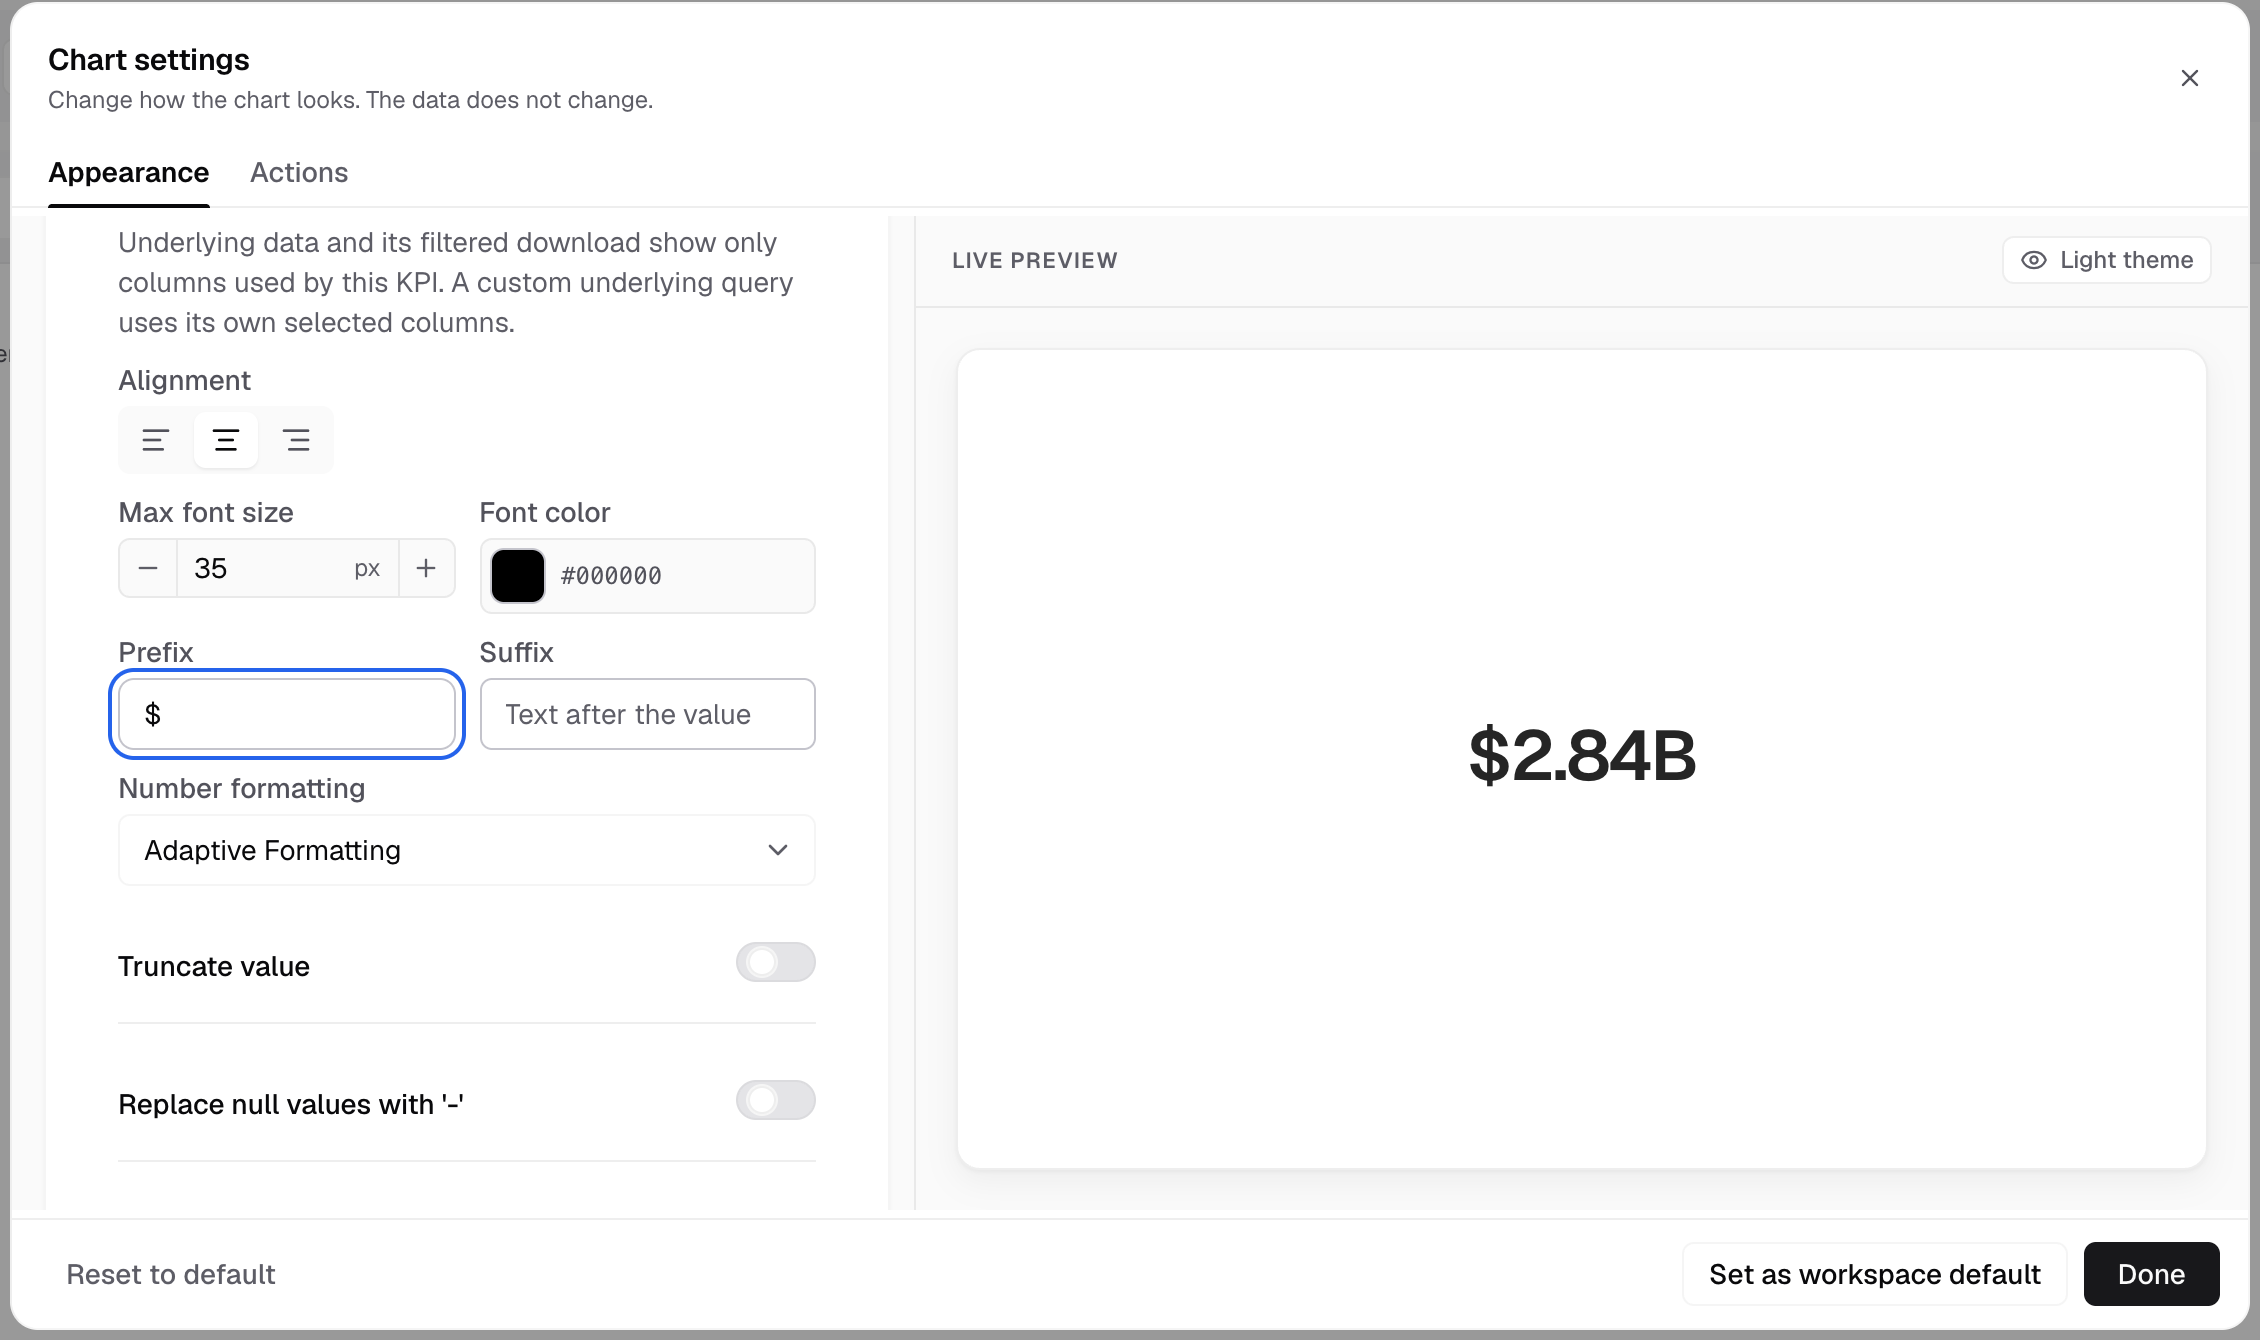
Prefix and Suffix are in Customizations. The preview shows the result. -
Select Done.
The card shows the formatted number.
Add a sub-header
- In Customizations, turn on Customize sub-header.
- Enter the Sub-header text.
- Set the alignment, font size, font weight and font color.
Compare with an earlier period
- Open Comparison value and turn on Show comparison value.
- Choose the Time column and the Time grain.
- In Show change as, choose Percentage or Difference.
Comparison value shows only when the metric can compare. Other options: Enable year over year, Comparison period lag, Indicator color and Trendline.
Color the value with a rule
- Open Conditional formatting and select Add rule.
- Choose a Rule type: Range or String.
- For a range, enter the Min value and Max value.
- Choose the Font color.
Other settings
- Card color sets a background color for the card.
- Actions has Custom Underlying Data and Alerts and Signals. Chart actions
To show a calculation from other metrics, see metric expression.