

Chart types
Set up a table
Show rows and columns with a Table or a Horizontal Stack Table, and style them.
Show the result as rows and columns. Horizontal Stack Table adds a stacked bar in each row.
What the data needs
| Chart | Dimensions | Measures |
|---|---|---|
| Table | Any | Any. Every field is a column. |
| Horizontal Stack Table | 1 or more, the rows | 1 or more, the stacked bar |
Steps
-
Add the fields to Dimensions and Measures.
-
In the chart toolbar, select Chart type, then Table or Horizontal Stack Table.
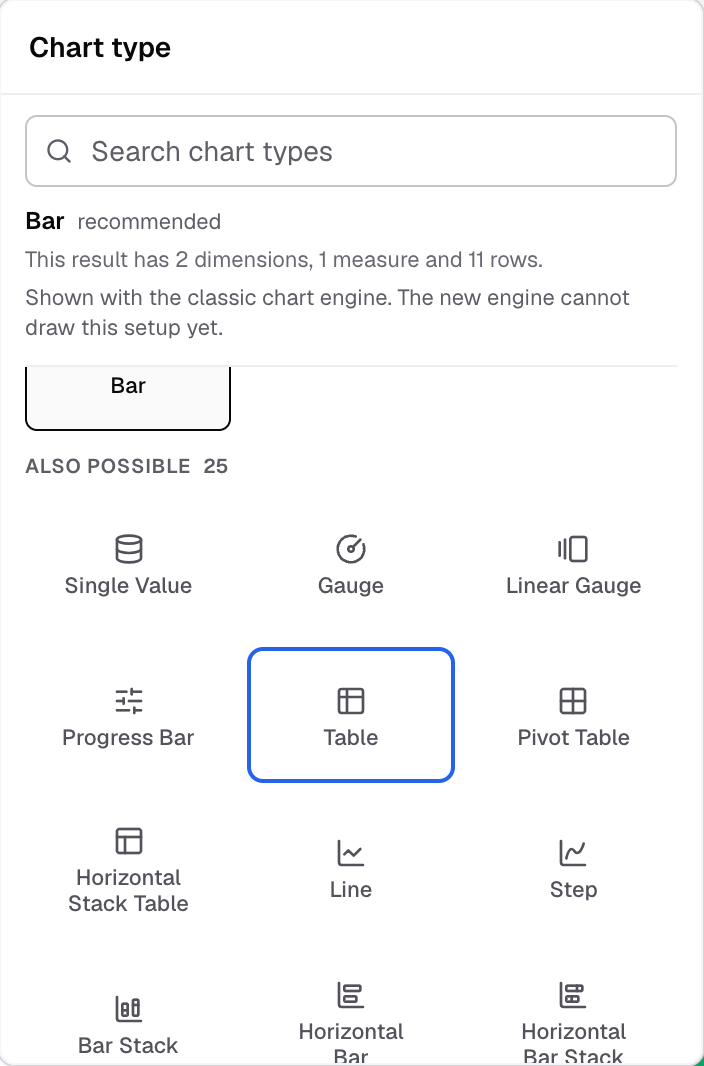
Table in the Chart type picker. -
Select Appearance.
-
Open a section and change the settings.
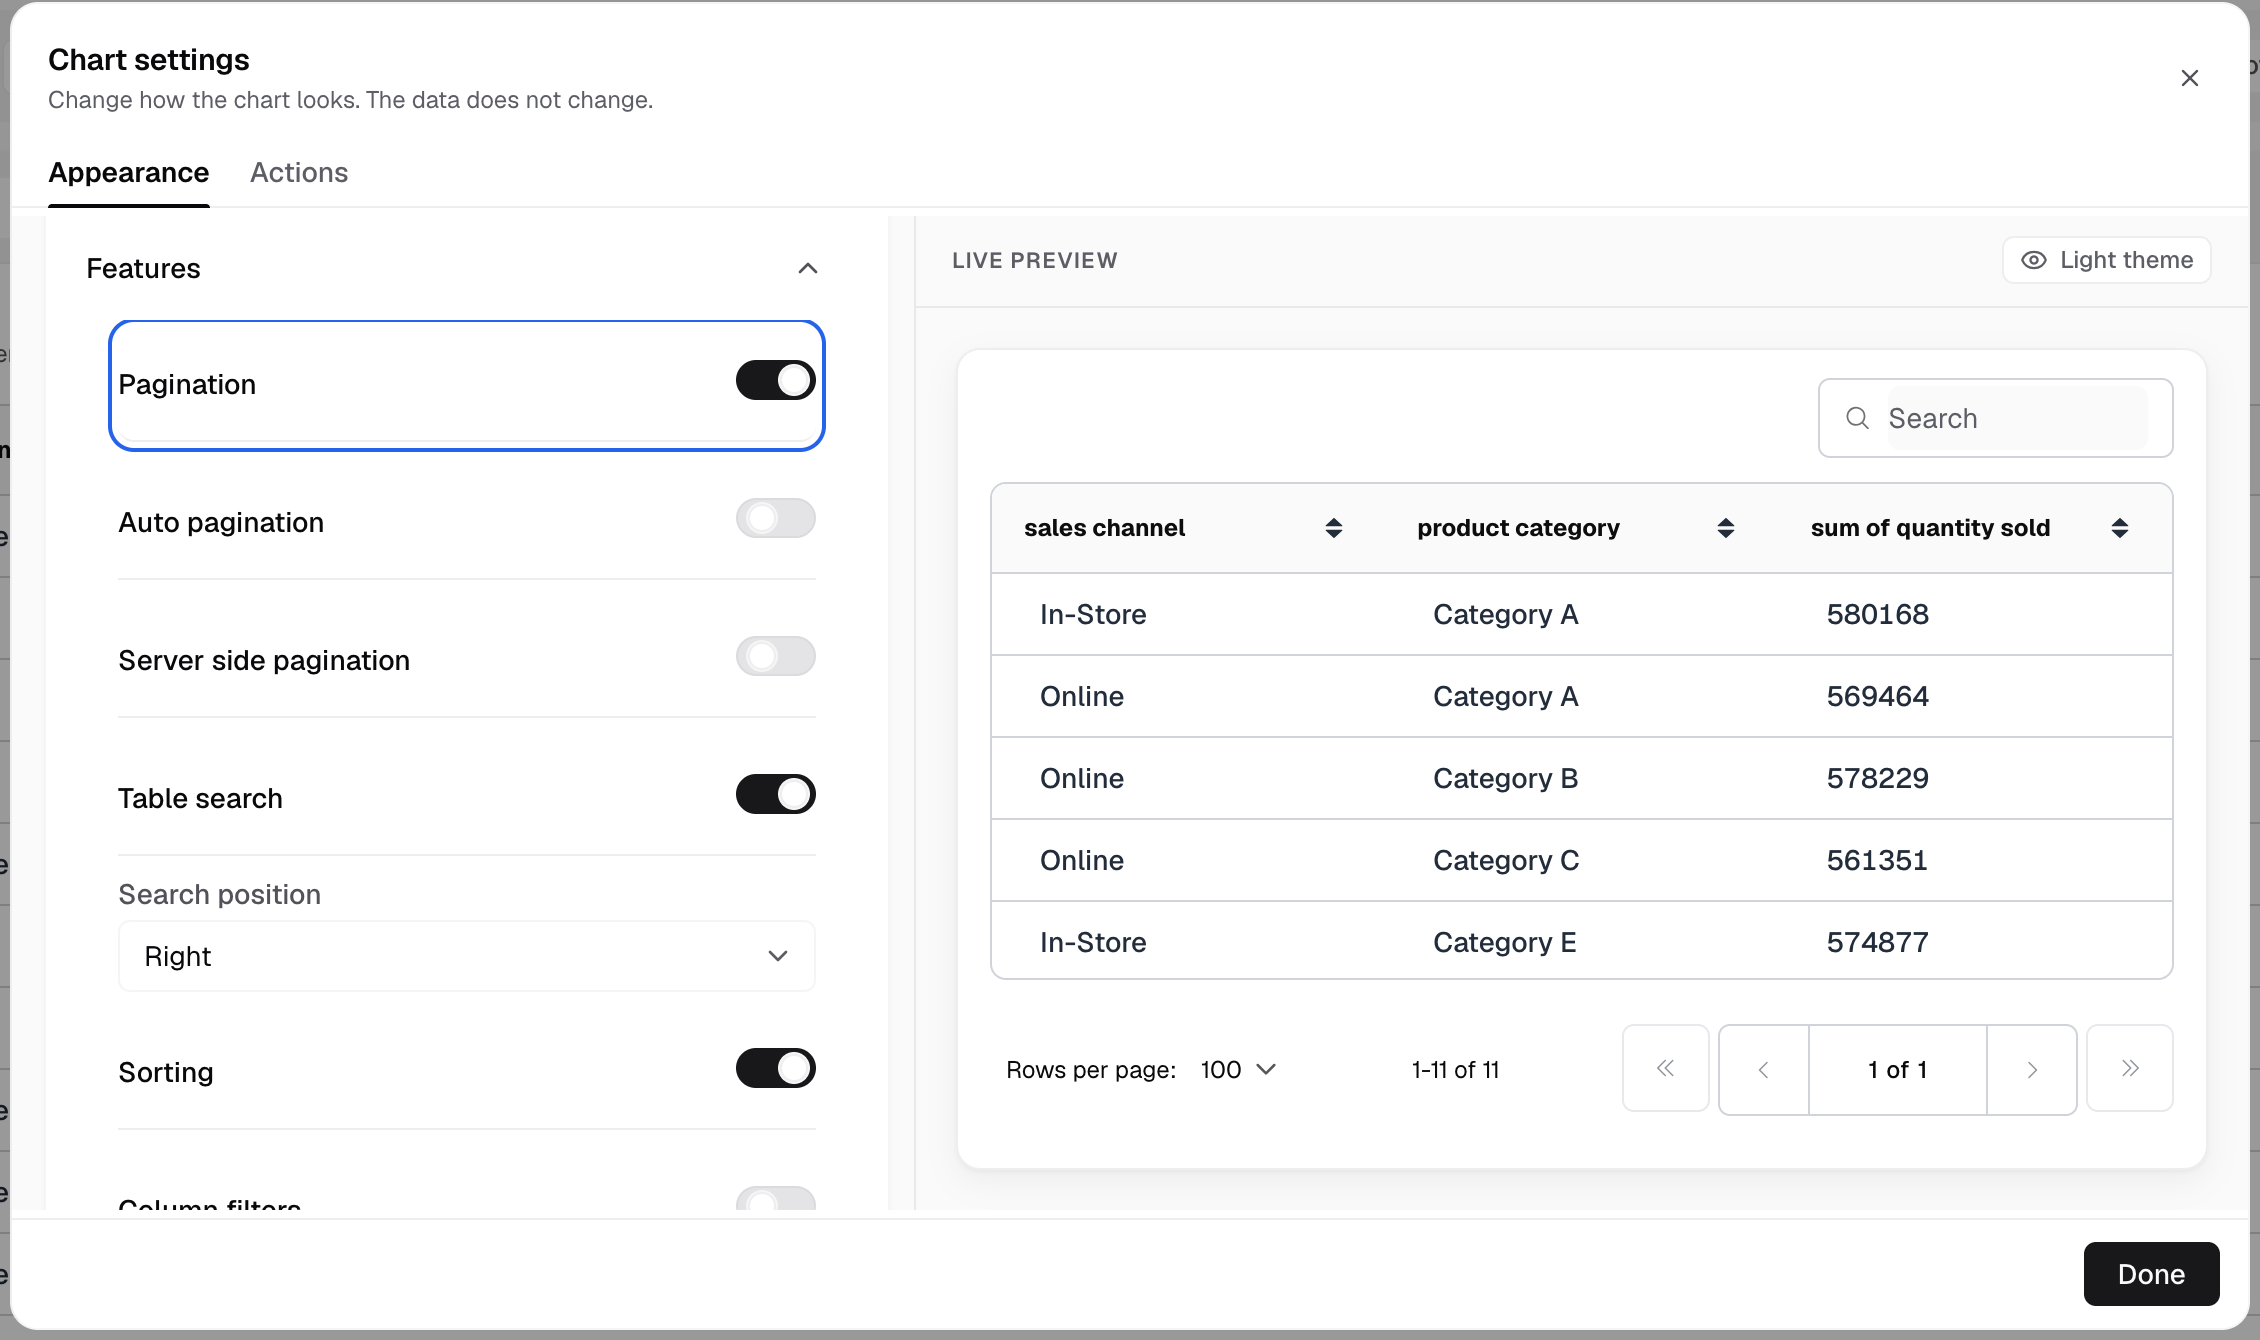
Features has Pagination, Table search, Sorting and more. -
Select Done.
Sections
| Section | What you set | Charts |
|---|---|---|
| UI styling | Table title, header, text wrap, content font, list and badge columns, dividers, striped rows, borders, Fit content | Both |
| Conditional formatting | Color the cells whose values meet a condition | Both |
| Formatting | Number format, prefix, suffix and date format per column | Both |
| Aggregate row | A total row, with a Label, Type and Columns | Table |
| Bar styling | Bar width, Top radius, Bottom radius | Horizontal Stack Table |
| Features | Pagination, Server side pagination, Table search, Sorting, Column filters, View details, Transpose data | Table |
Color cells with a rule
- Open Conditional formatting and add a rule.
- Choose the Columns and the Condition.
- Enter the value to compare with.
- In Color applies to, choose Background or Badge.
- Choose the colors.
With Transpose data on, the Formatting and Aggregate row sections are hidden.
Reset to default and Set as workspace default do not show for tables.
Next: set up a pivot table.