

Chart actions
Add a chart click action
Open a link, send a value to your code, or open another dashboard when a viewer clicks a chart.
A viewer clicks a bar, point, slice or row. Databrain opens a URL with that value, or hands the value to your app.
Before you start
- Your role has the Chart Click Actions permission. The default Admin, Editor and Developer roles have it.
- The chart is not a pivot table, horizontal stack table, trend analyzer or box plot. These have no chart click action.
- If Drill down is on, select the last drill level first. Chart click actions show only there.
Open a URL with the clicked value
-
Open the metric in the metric builder.
-
In the chart toolbar, select Appearance, then Actions.
-
Turn on Chart Click Actions.
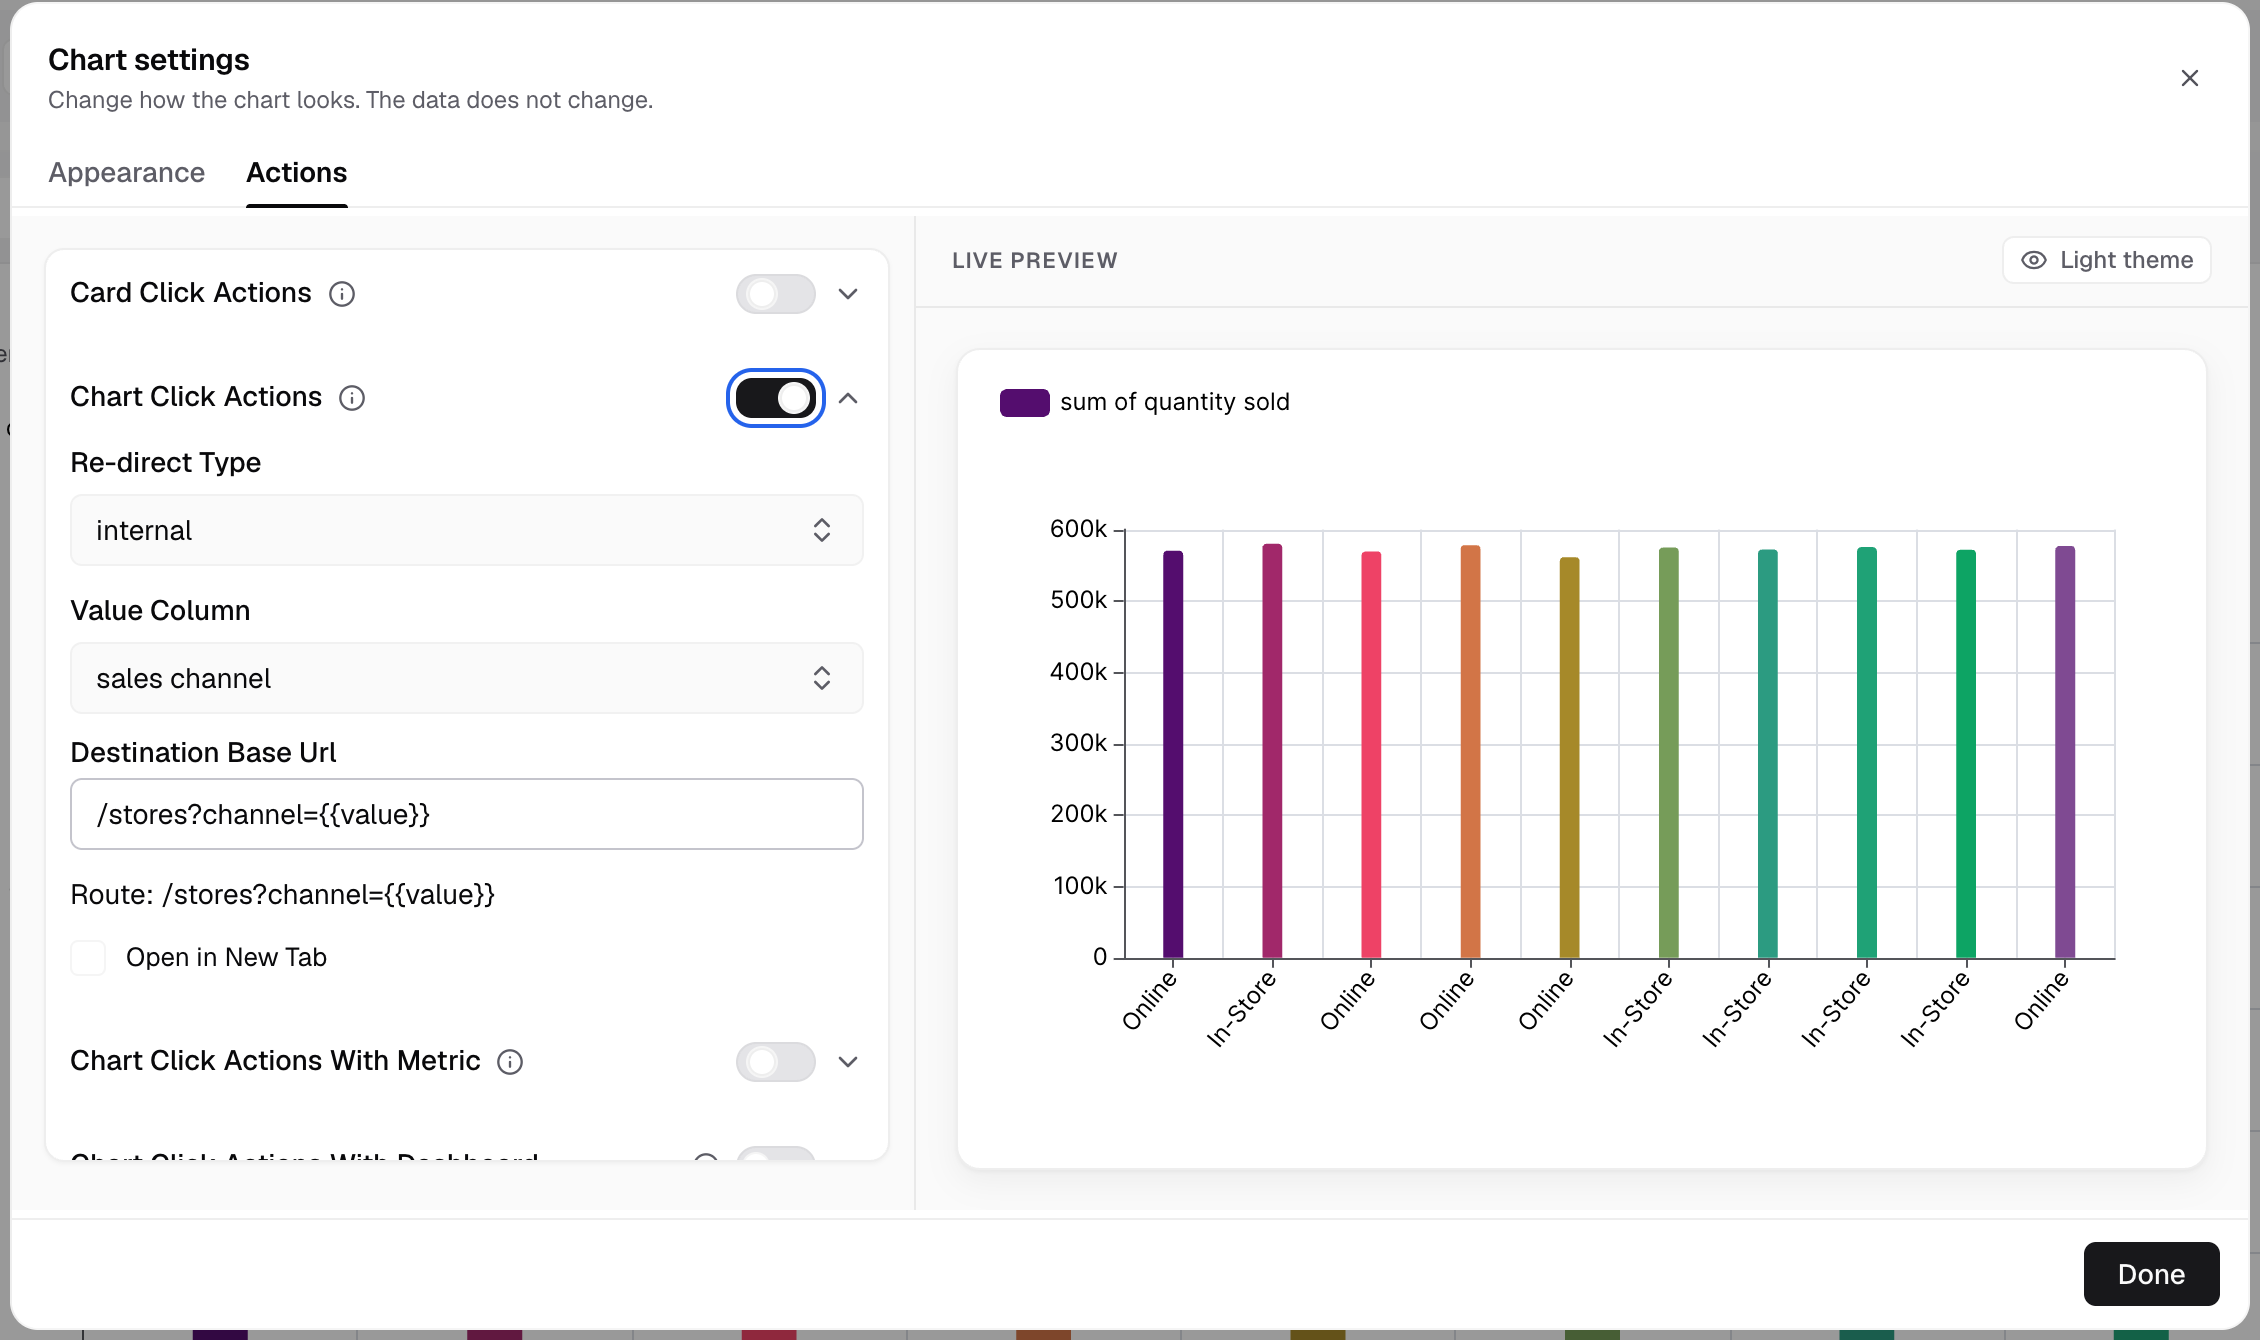
Turn on Chart Click Actions to see its fields. -
In Re-direct Type, select Re-direct to internal route or Re-direct to external website. The field then shows
internalorexternal. -
In Value Column, select the column whose value the click sends.
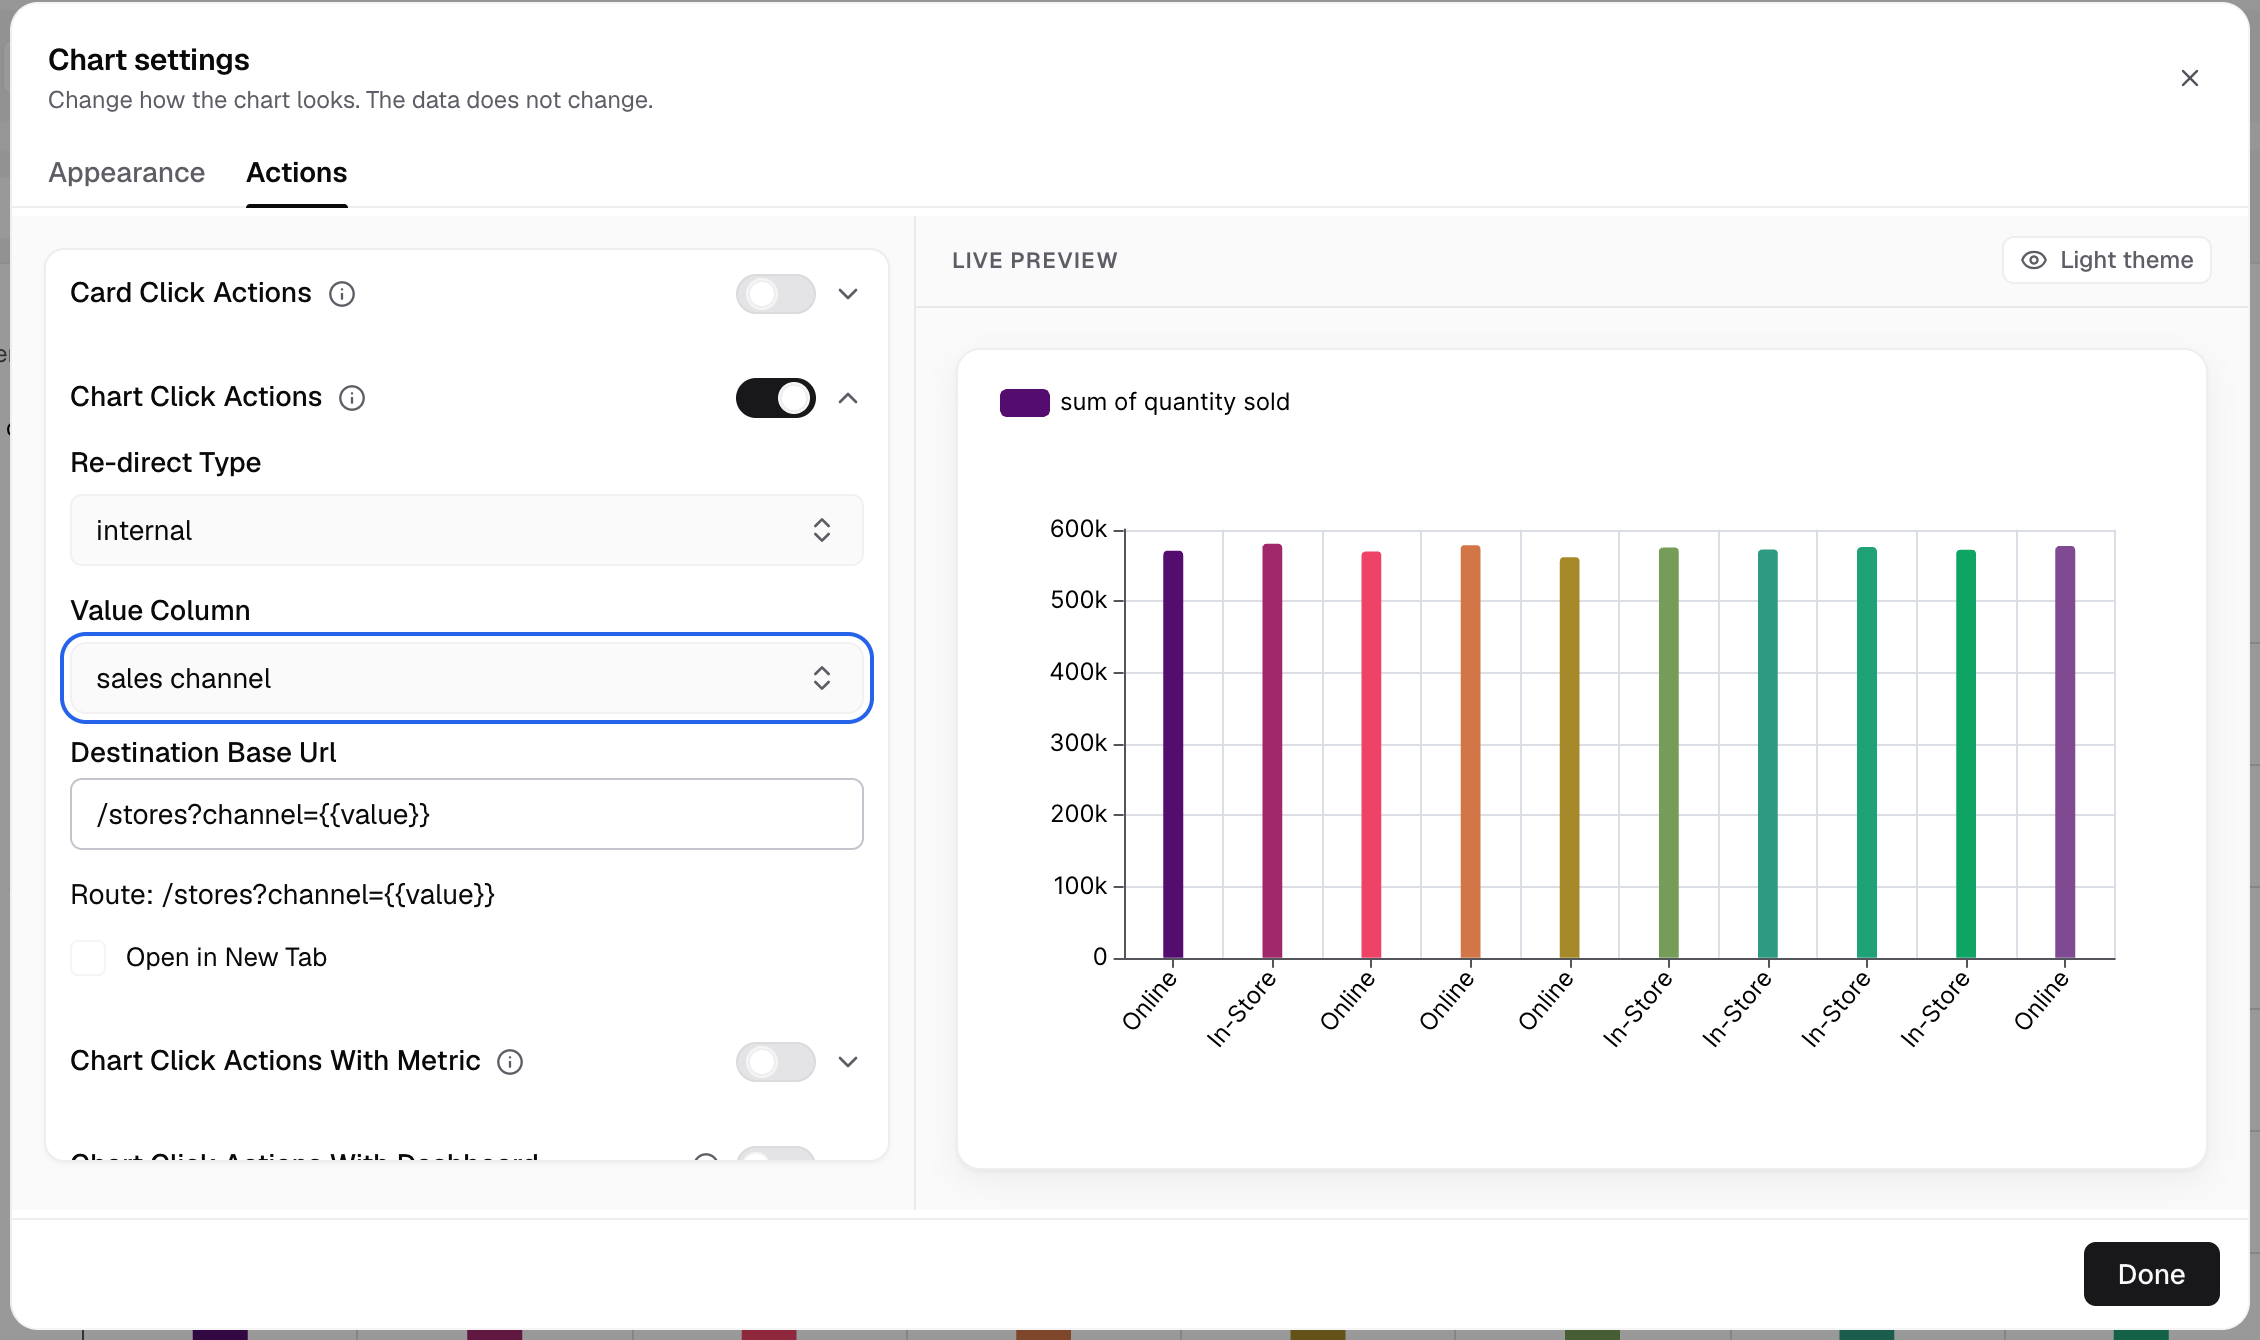
Value Column sets which value the click sends. -
In Destination Base Url, enter the URL. Put
{{value}}where the clicked value goes, for example/orders?region={{value}}.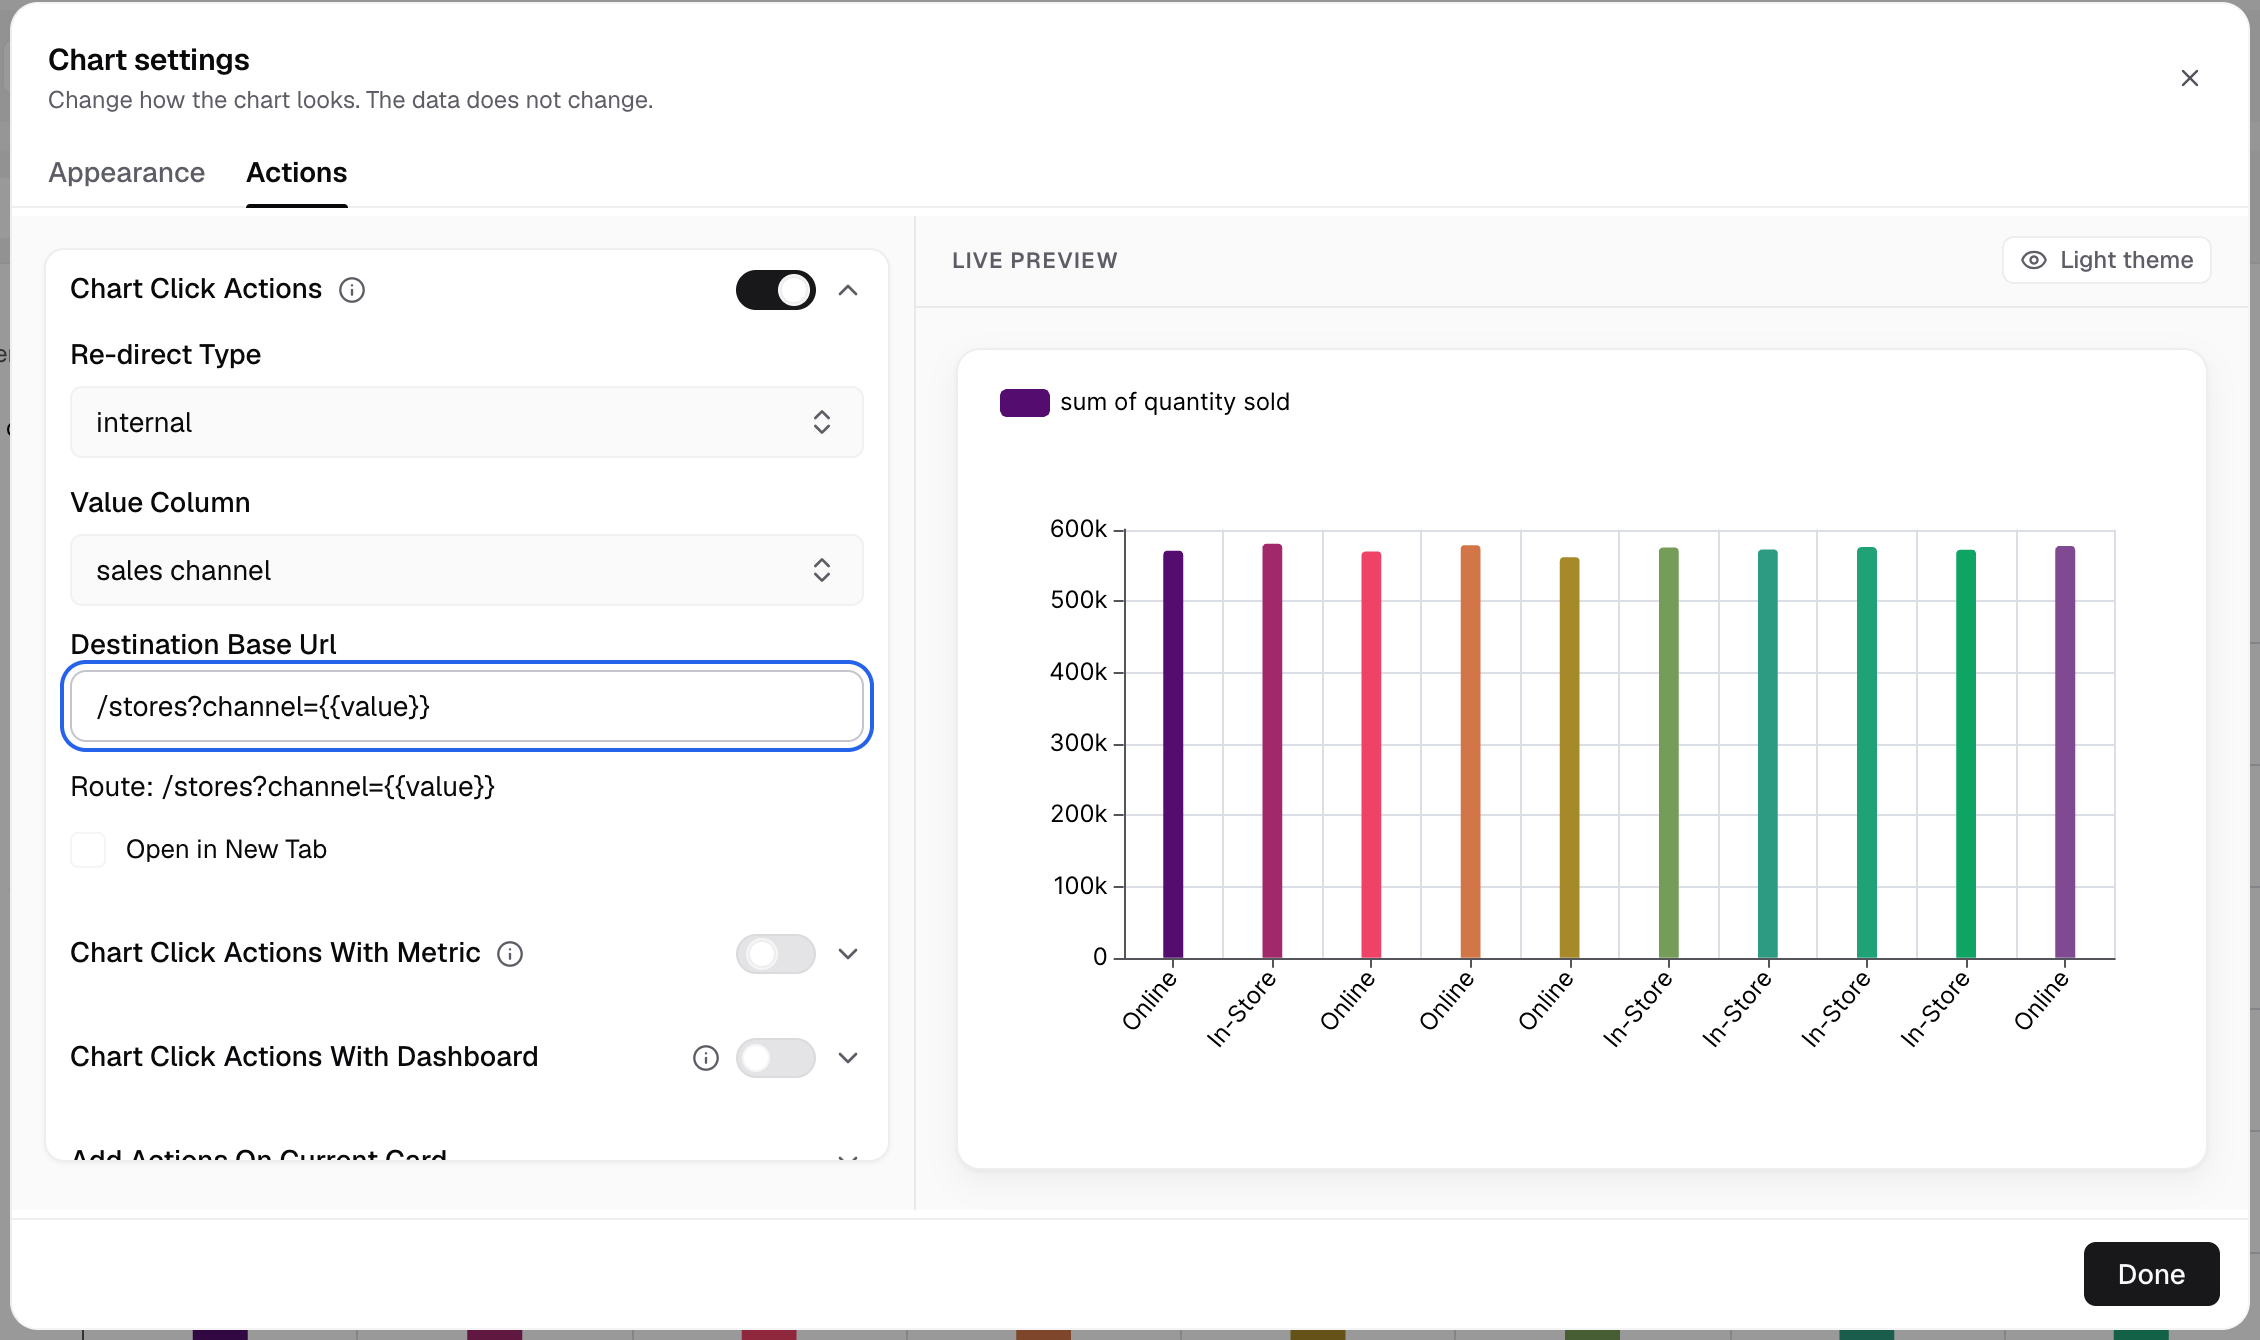
Put {{value}} where the clicked value goes. The Route line shows the result. -
Check the read-only Route line.
-
To open the link in a new browser tab, select the Open in New Tab checkbox.
-
Save the metric.
On the dashboard, a click on a data point opens your URL with the clicked value. Right-click or long-press opens the point menu, with Open link as its first row.
The default route is /{{value}}. If you remove {{value}}, the URL opens as you typed it, with no value. Databrain encodes the value for a URL and removes quotes.
Only internal paths and http or https links are allowed. Databrain refuses javascript: links, links that start with //, backslashes and links with a user name or password.
Send the value to your code
Use this in an embed, when your app decides what a click does.
- In Re-direct Type, select Re-direct value to user function.
- In Value Column, select the column to send.
- To send the whole clicked row instead, select Pass Complete Data to Function. Value Column is then off.
- Save the metric.
A click sends the value to your embed’s chartClickFunction. In the point menu, the row is Run click action. In the metric builder preview, this action does nothing.
Make a table clickable
For a table chart, Chart Click Actions has three switches instead of the form above. On a table, the viewer clicks the link-styled cell, or right-clicks a cell.
- Row Redirection: the whole row is clickable. Set Re-direct Type, Value Column and the URL, as in the steps above.
- Column Redirection: each cell of a column is a link. Select Add Link and pick a Select Column. Enter a Destination Base Url with
{{value}}for the cell value. Select Save. - Value Redirection: one cell value is a link. Select Add Link and enter the cell value in Custom Text. Enter a Destination Base Url and select Save. The link opens as typed.
Turning Column Redirection or Value Redirection off or on clears its saved links.
Open another dashboard from a chart
Chart Click Actions With Dashboard opens a different dashboard of the same workspace, filtered to the clicked value.
Before you start:
- Open the metric from a dashboard in a workspace. Without a workspace, you cannot pick a destination.
- The workspace has a second dashboard, and that dashboard has a filter.
Steps:
-
Turn on Chart Click Actions With Dashboard.
-
In Destination dashboard, select the dashboard to open.
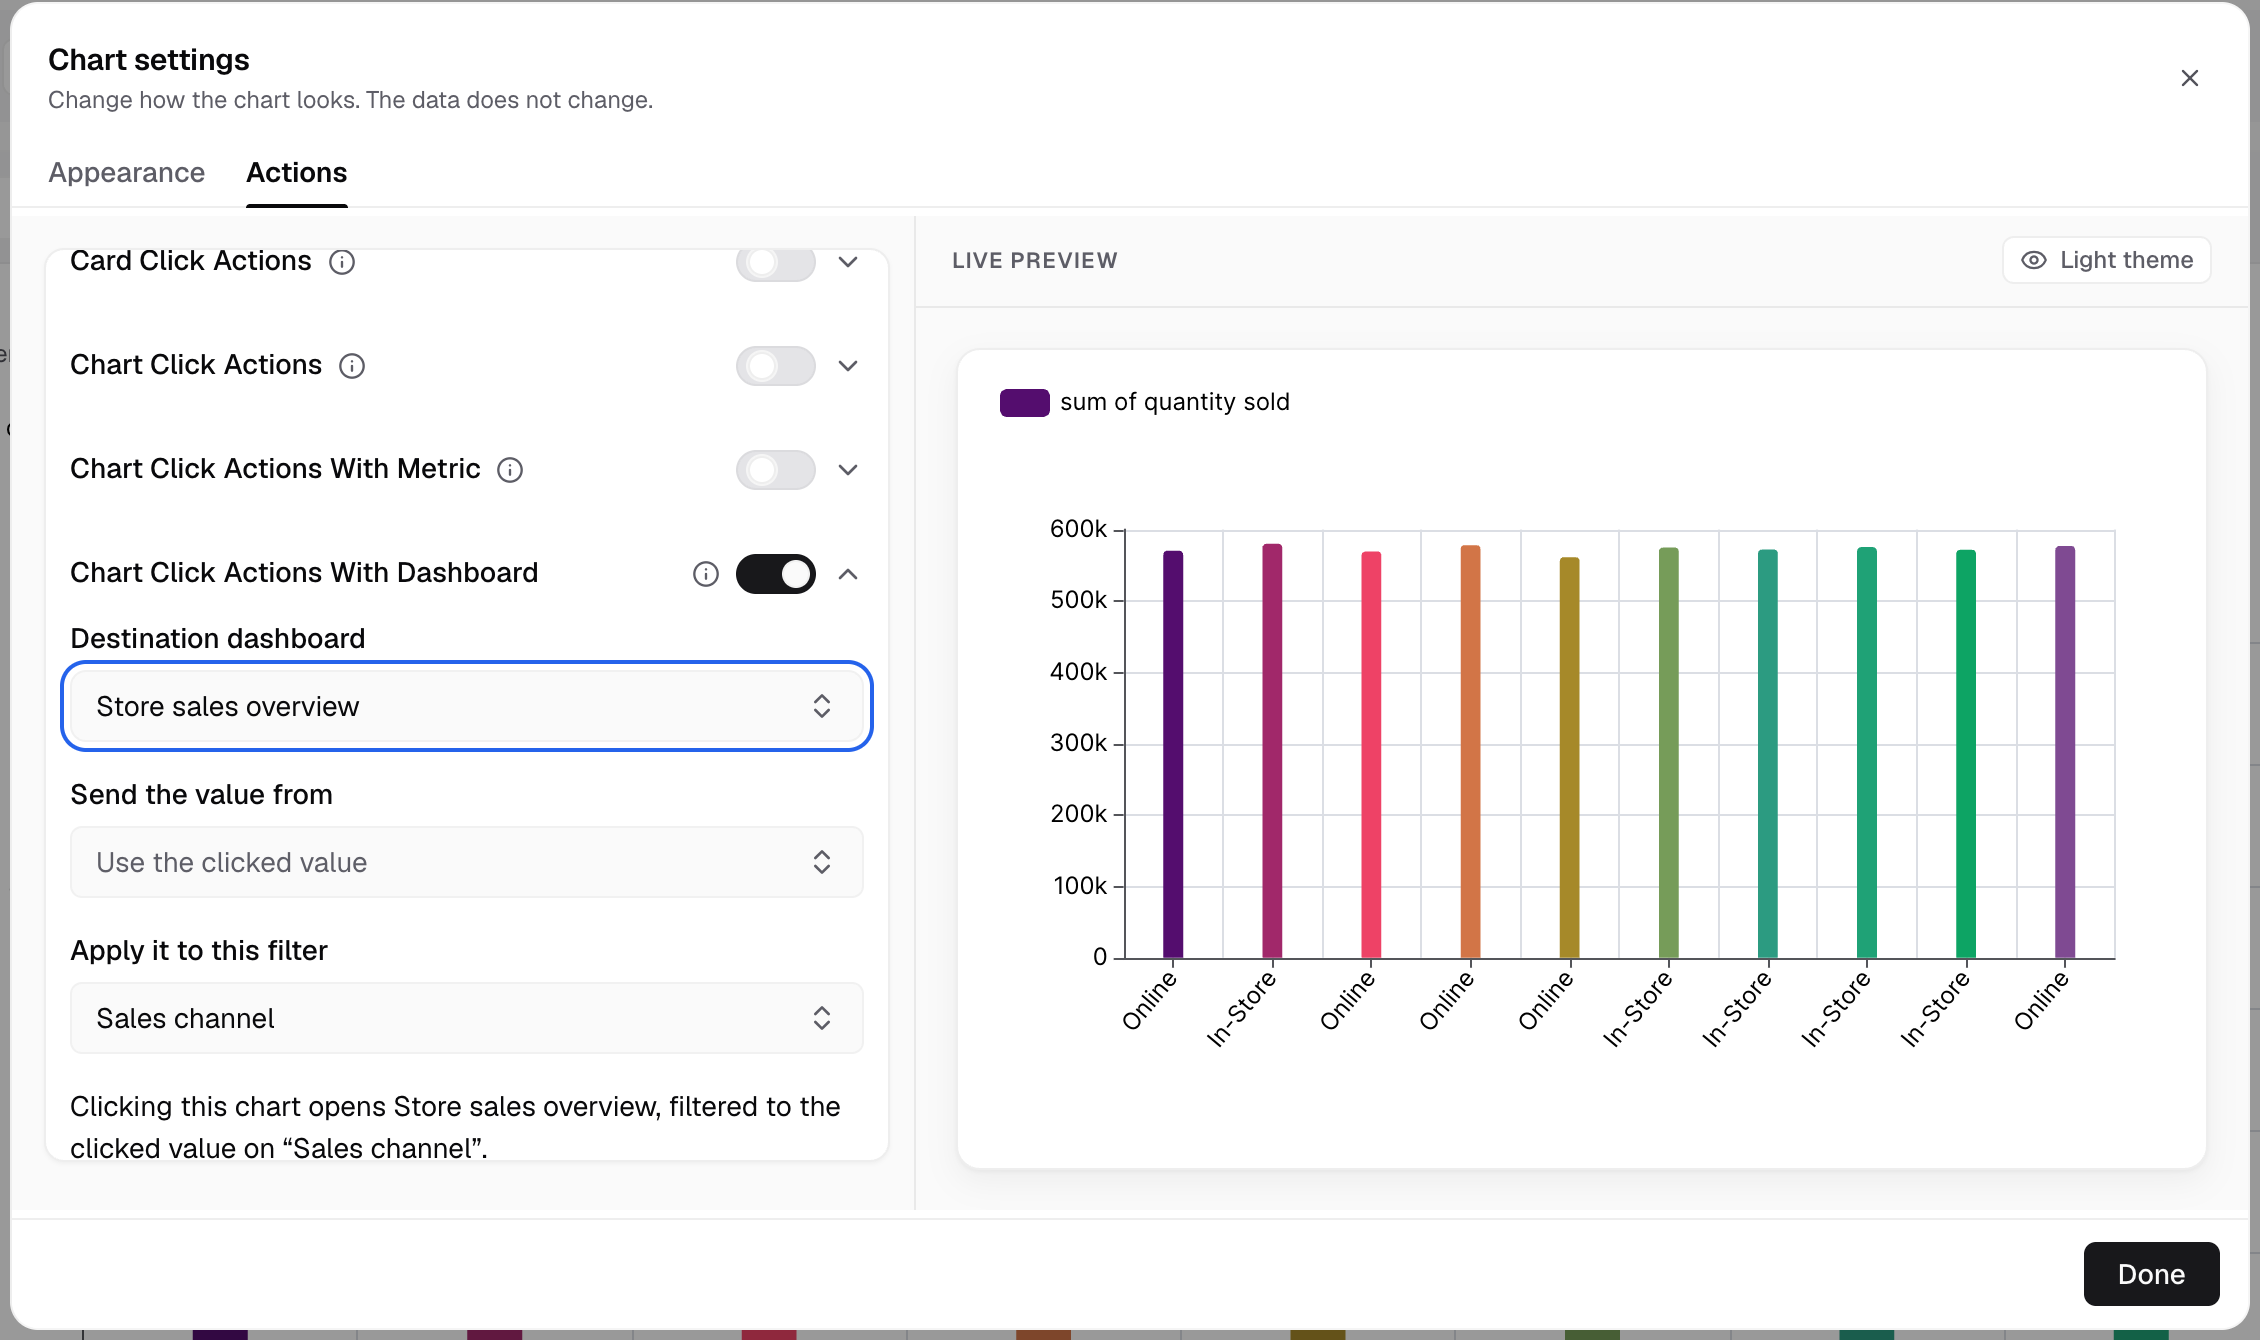
Destination dashboard is the dashboard that opens. -
In Send the value from, select a column. Leave it empty to send the clicked value.
-
In Apply it to this filter, select a filter of the destination dashboard.
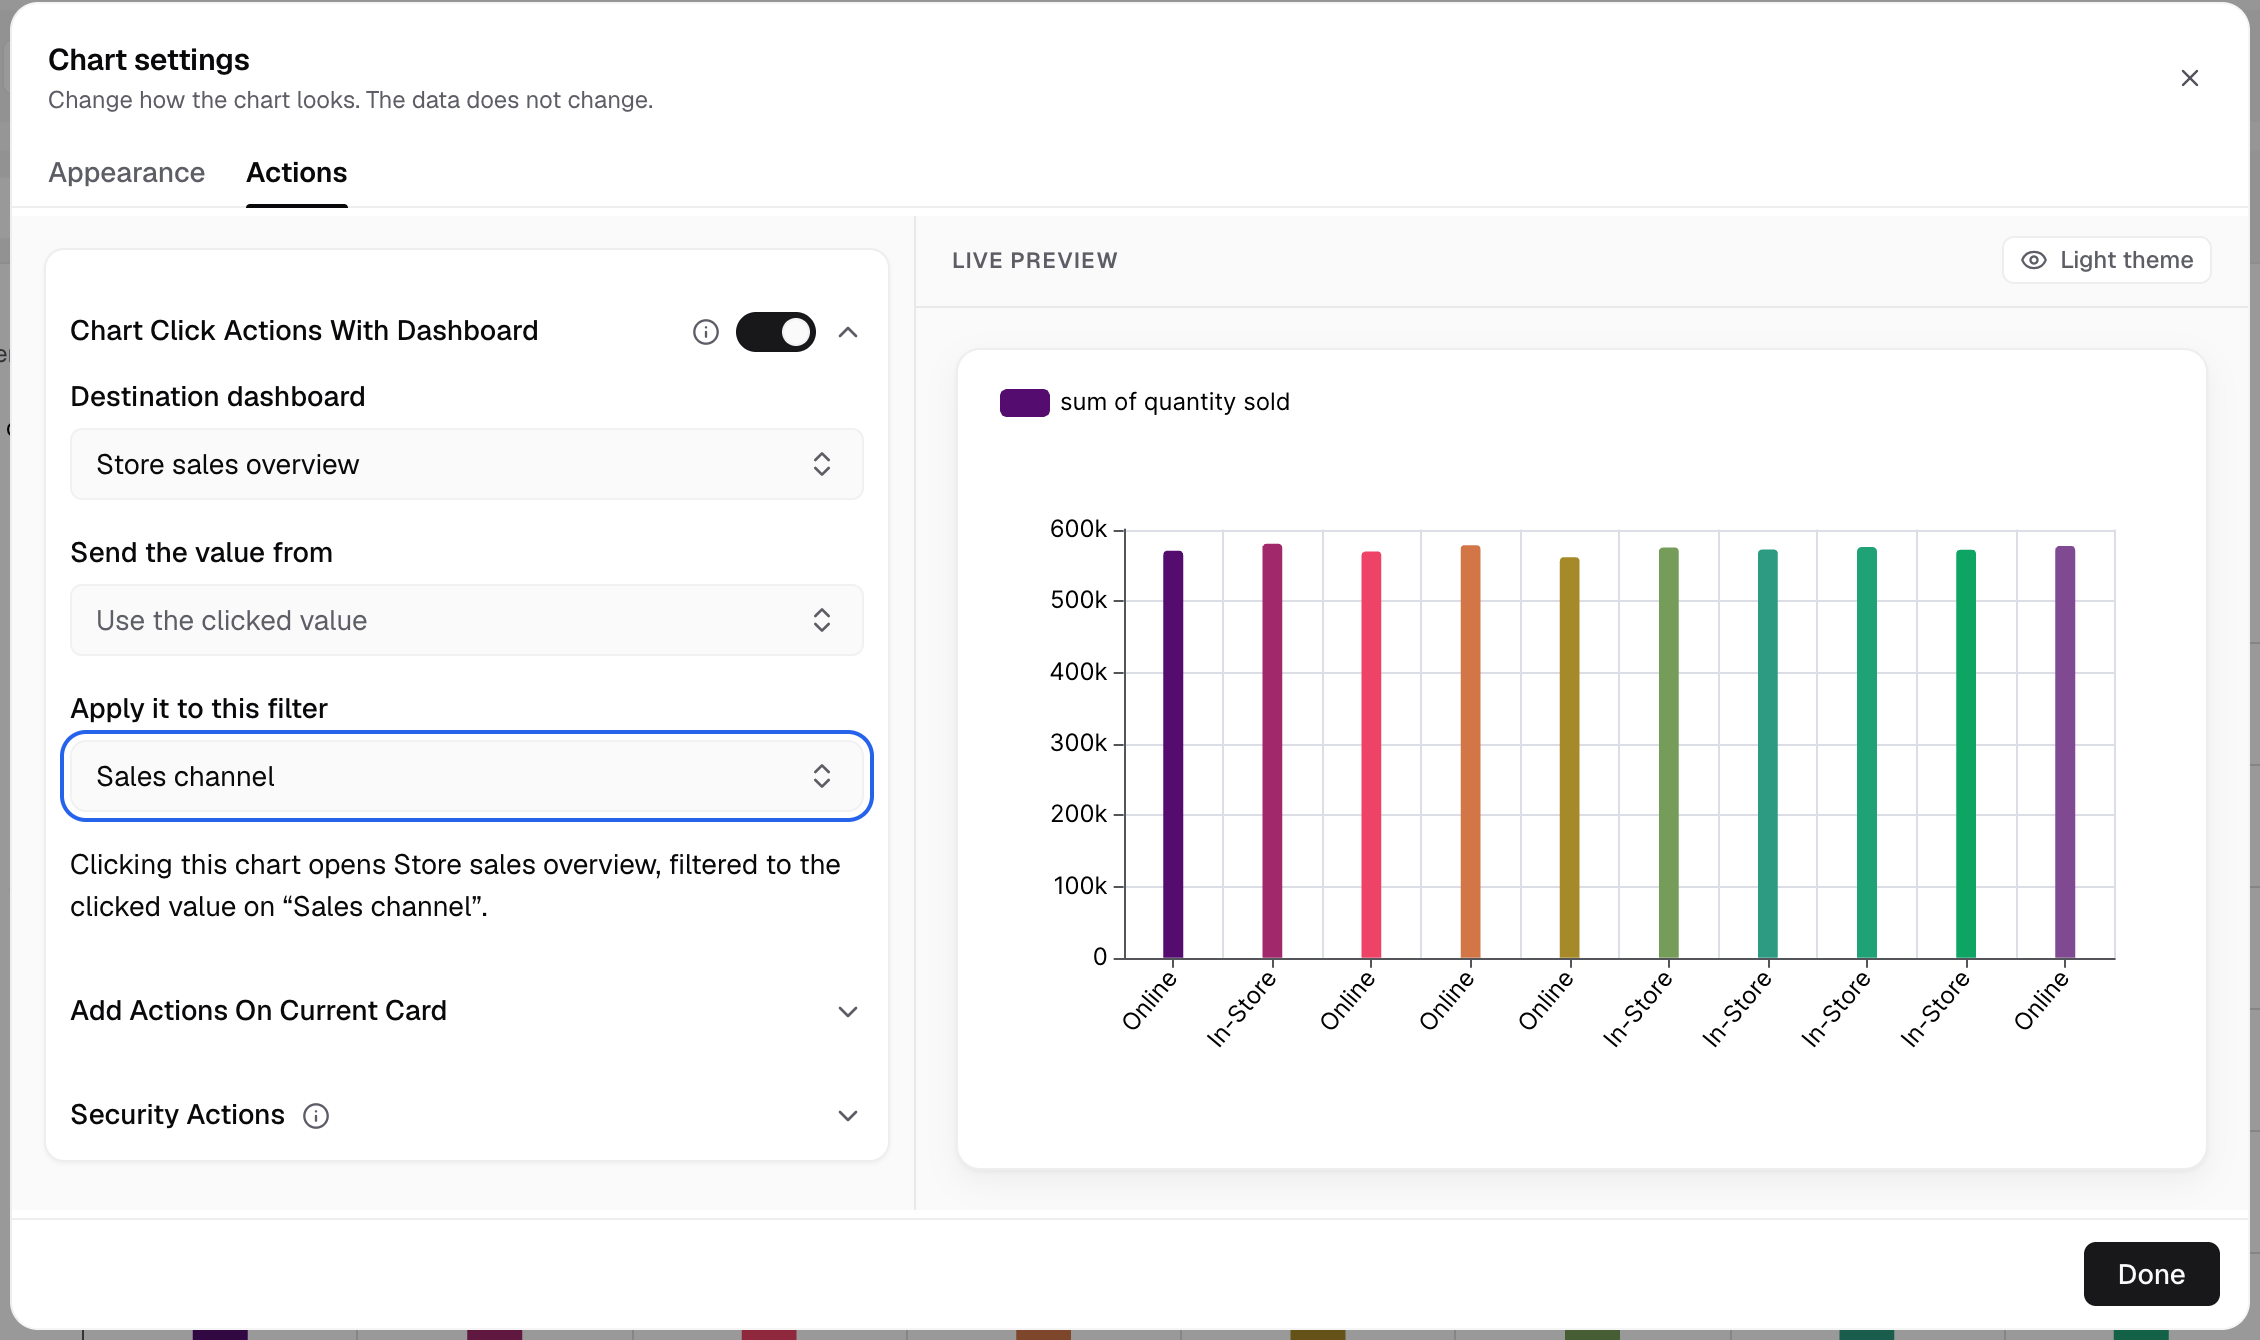
The summary line under the fields says what the click does. -
Read the summary line. It says which dashboard opens and which filter gets the value.
-
Save the metric.
On the dashboard, a click on a value opens the destination with the value in the chosen filter. In the point menu, the row is Open dashboard.
The destination also keeps the source dashboard’s filters that use “equals”. Other filter types do not pass. The clicked value wins over a filter on the same column.
In an embed
An embed never moves your page. Turn on the enable-chart-dashboard-navigation attribute on the embed. A click then calls your chartClickFunction with this payload:
{
  kind: 'dashboard',
  dashboardId: '...',
  filters: [{ column: '...', value: '...' }],
  openInNewTab: false,
  path: '...',
  embedDashboardId: '...',
  globalFilterOptions: { '<filter>': { arrivalValue: '...' } }
}
Check payload.kind. A plain chart click action sends a bare value to the same function. To show the destination, mount a new embed with embedDashboardId and globalFilterOptions.
Databrain checks each click on the server. If the guest token cannot open the destination, nothing opens.
Next, open a metric from a chart.
If something goes wrong
- “Only internal paths or http/https links are accepted.” Change the URL to a path that starts with
/, or to anhttporhttpslink. - “Open this metric from a workspace to pick a destination dashboard.” Open the dashboard from its workspace, then edit the metric from there.
- “This workspace has only this dashboard.” Create another dashboard first.
- “The dashboard you picked has no filters yet.” Add a filter to the destination dashboard. See Dashboard filters.