

Create a metric
Create a metric
Build a chart from your data and save it to a dashboard.
Build a chart from your data and save it to a dashboard.
Before you start
- You are an Admin, Editor or Developer. Viewers cannot open the metric builder.
- Your workspace has a connected datasource. Add a datasource
Steps
-
Go to Home and select New metric.
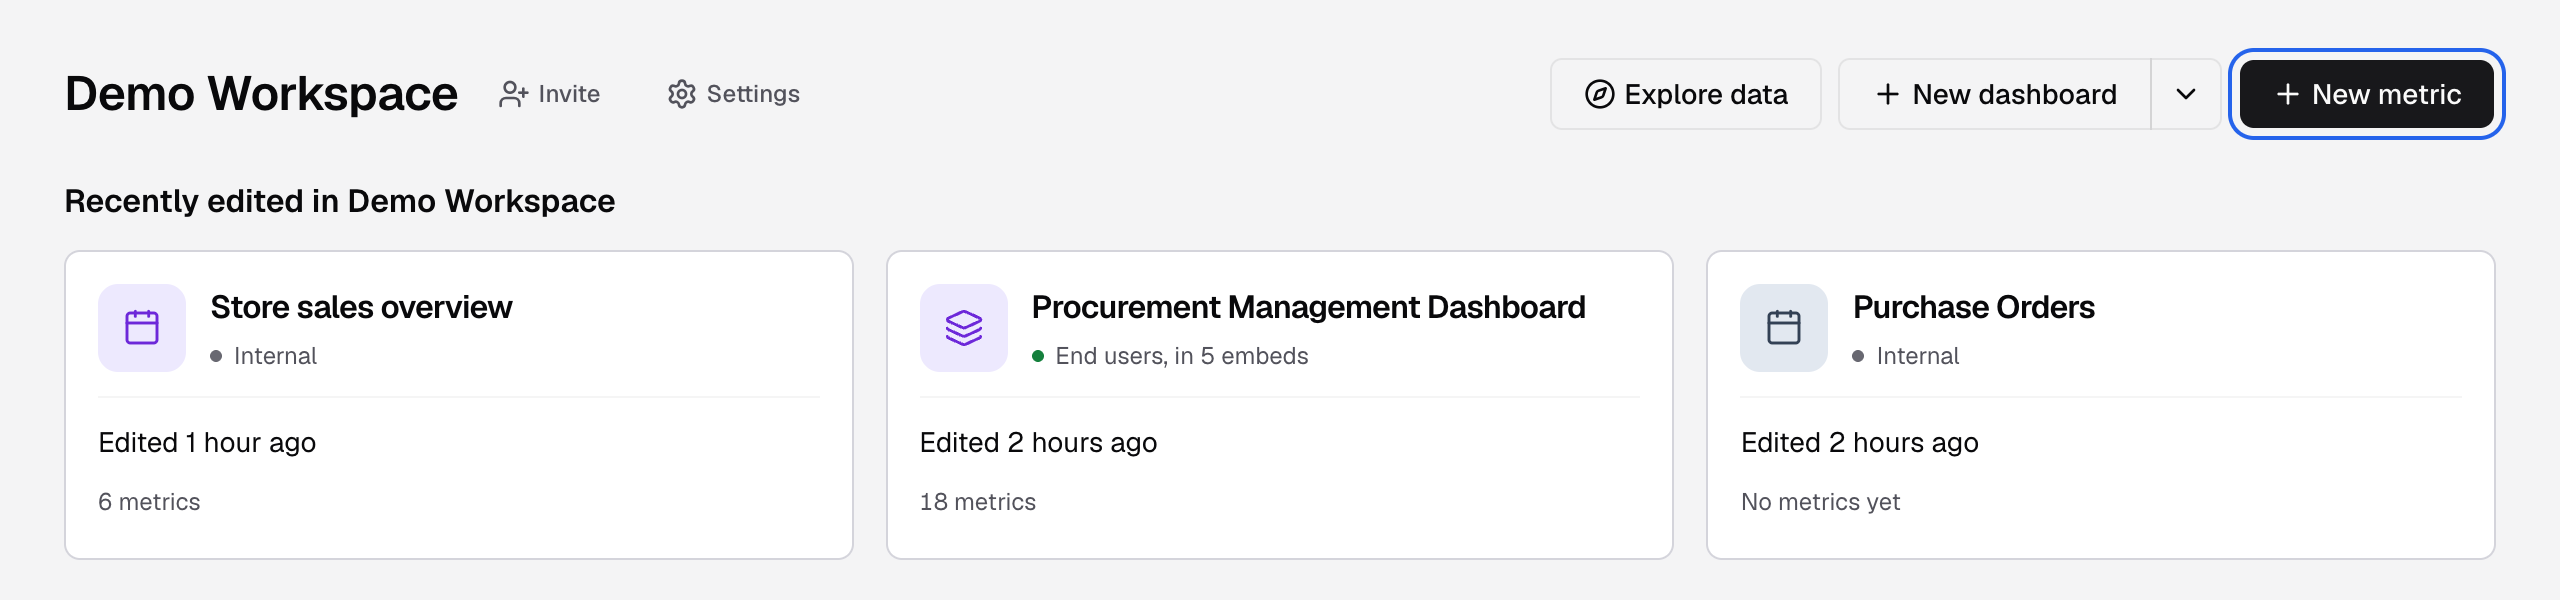
New metric is at the right of the workspace header on Home. -
In the left panel, keep the Schema tab open.
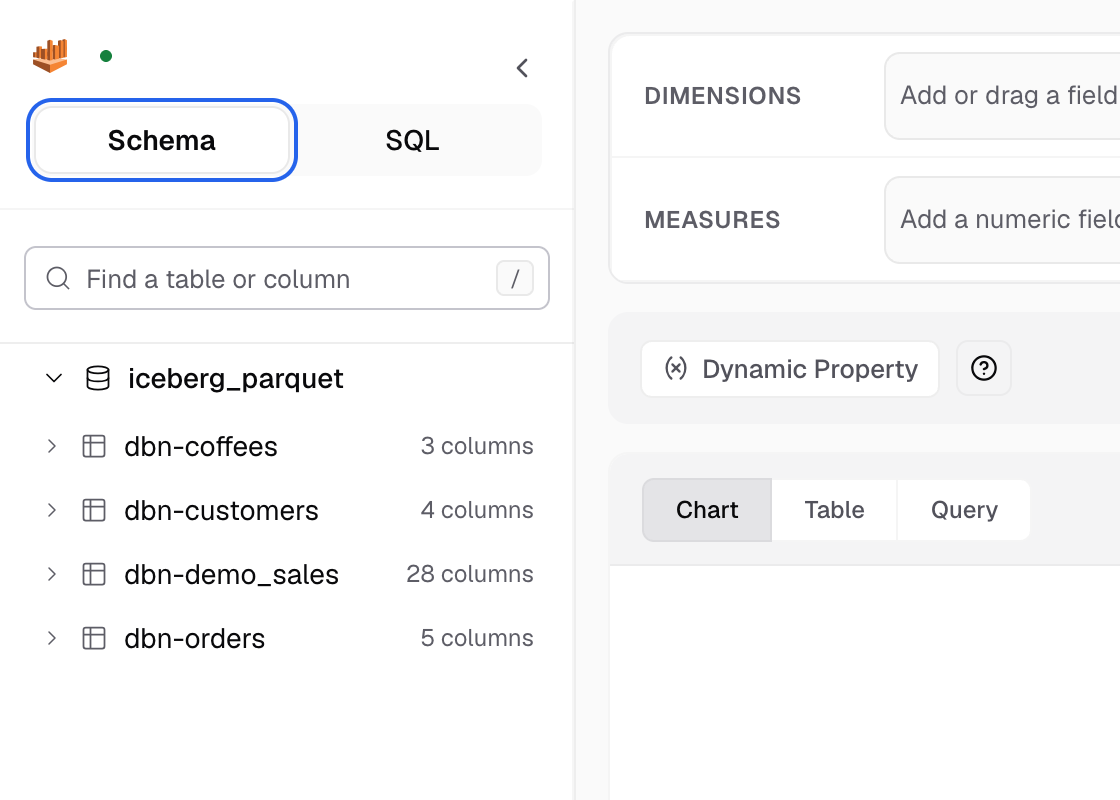
The Schema tab lists your tables and columns. -
Find a column with Find a table or column.
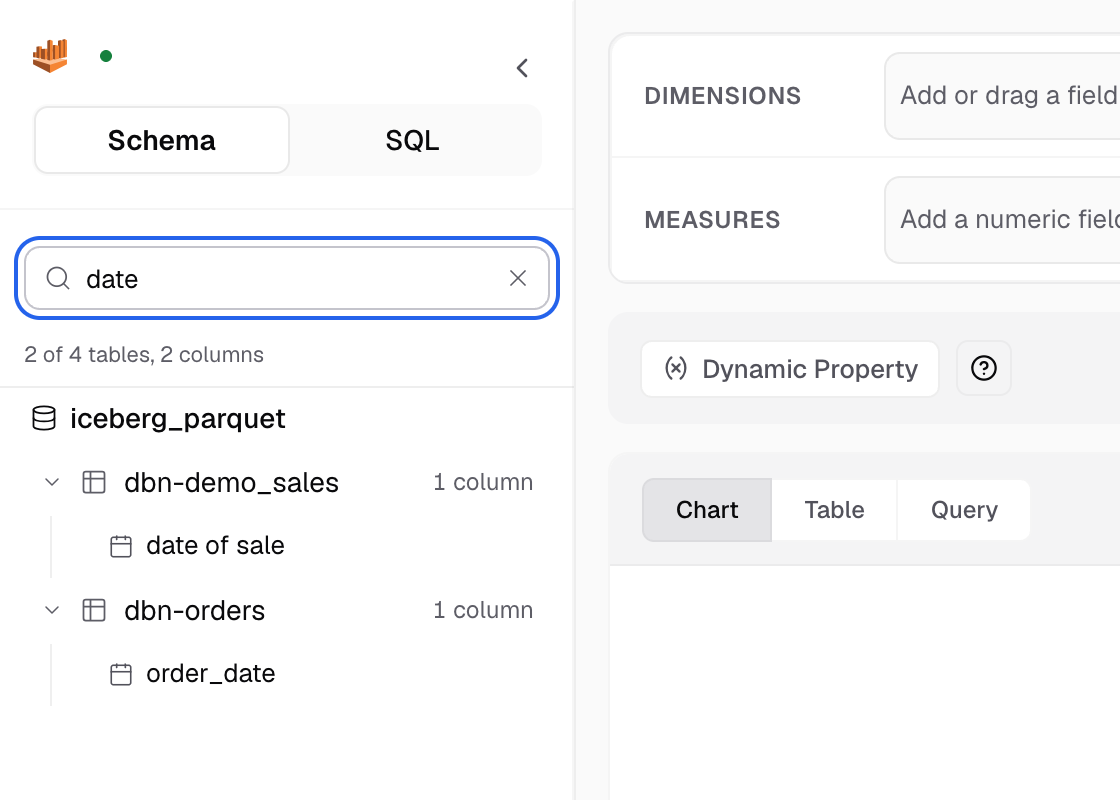
Type to narrow the tables and columns. -
Drag a column into Dimensions, for example
order_date. You can also select Add dimension.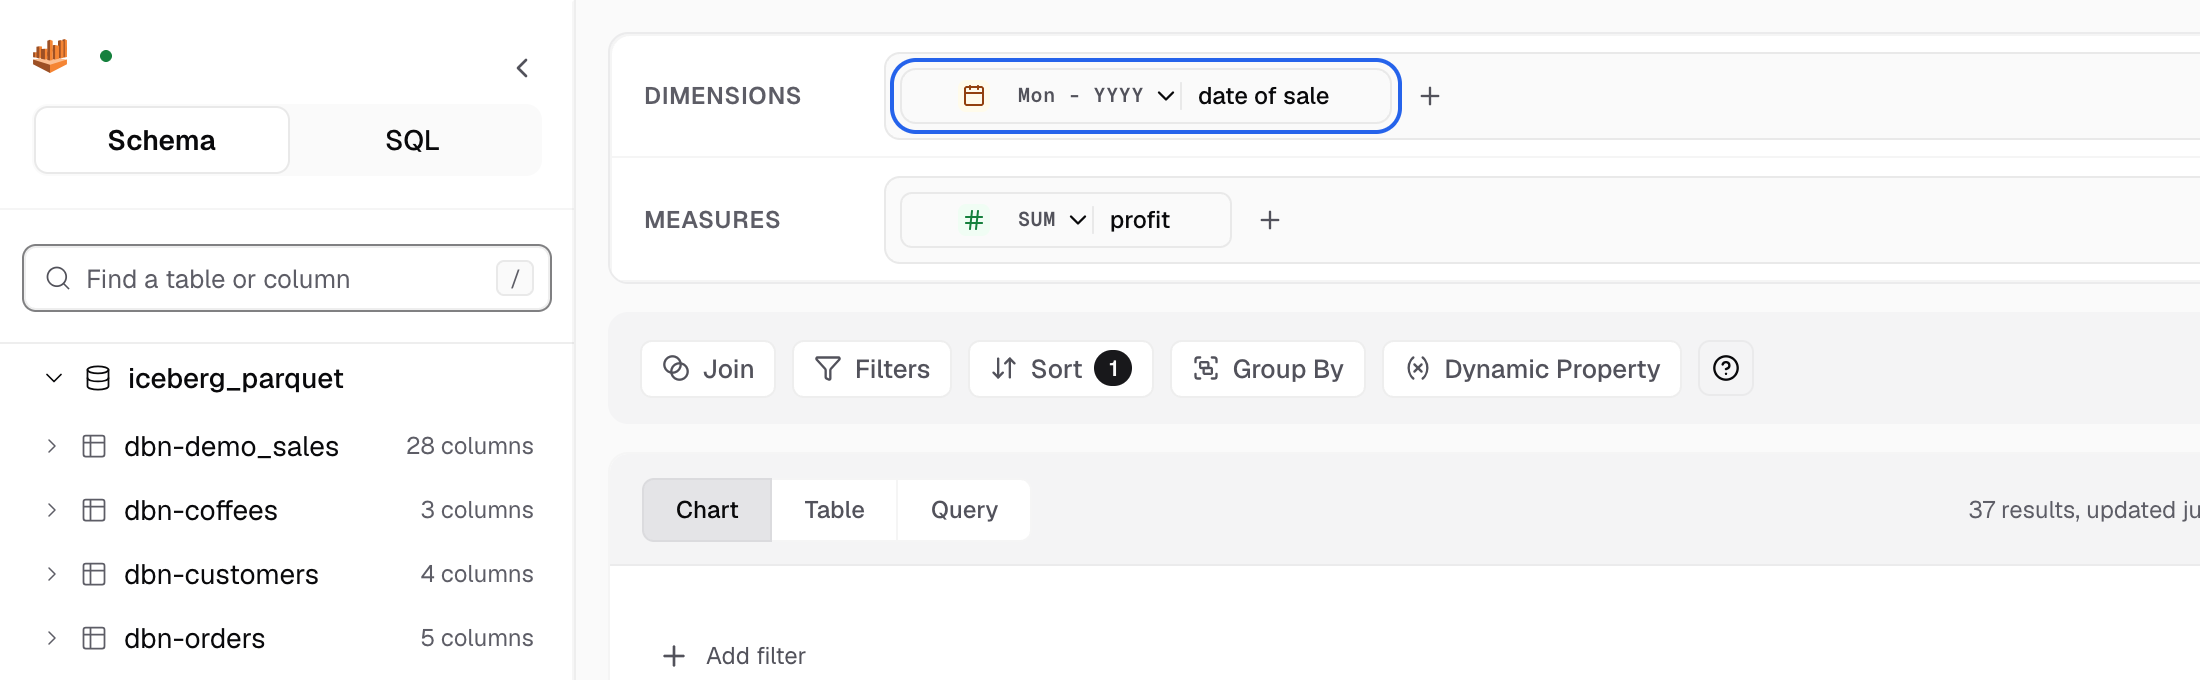
The column lands in Dimensions; a date gets a format such as Mon - YYYY. -
Drag a number column into Measures, for example
amount. You can also select Add measure.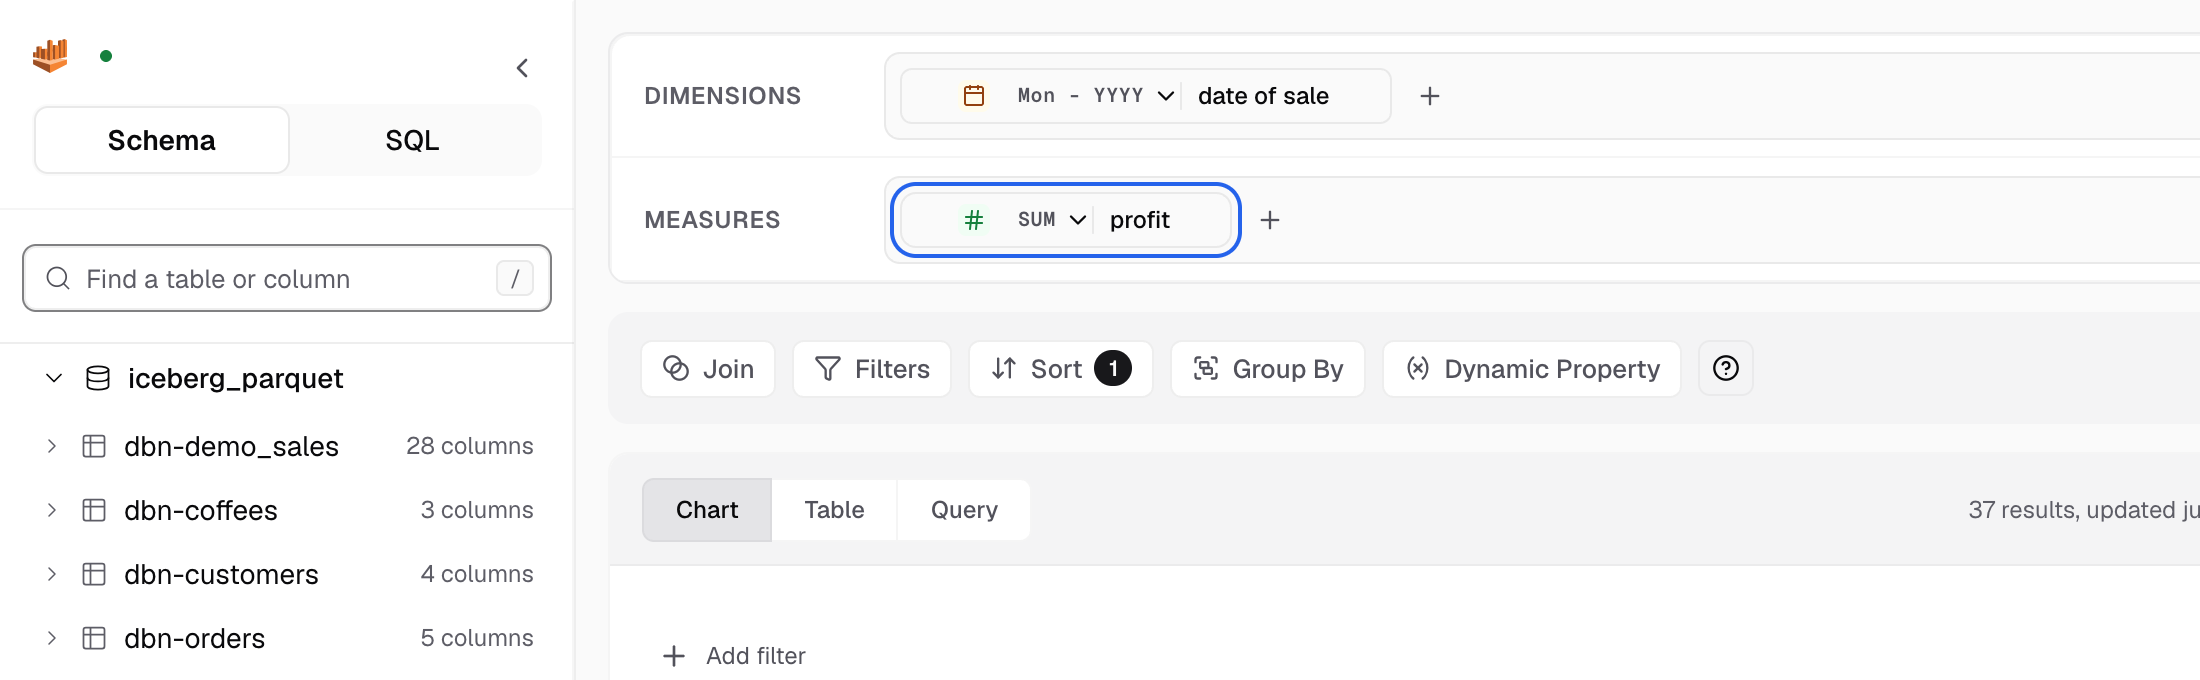
The number column lands in Measures with its function badge. -
Check the function badge on the measure. A number comes in as SUM. Select the badge to pick another function, for example AVG.
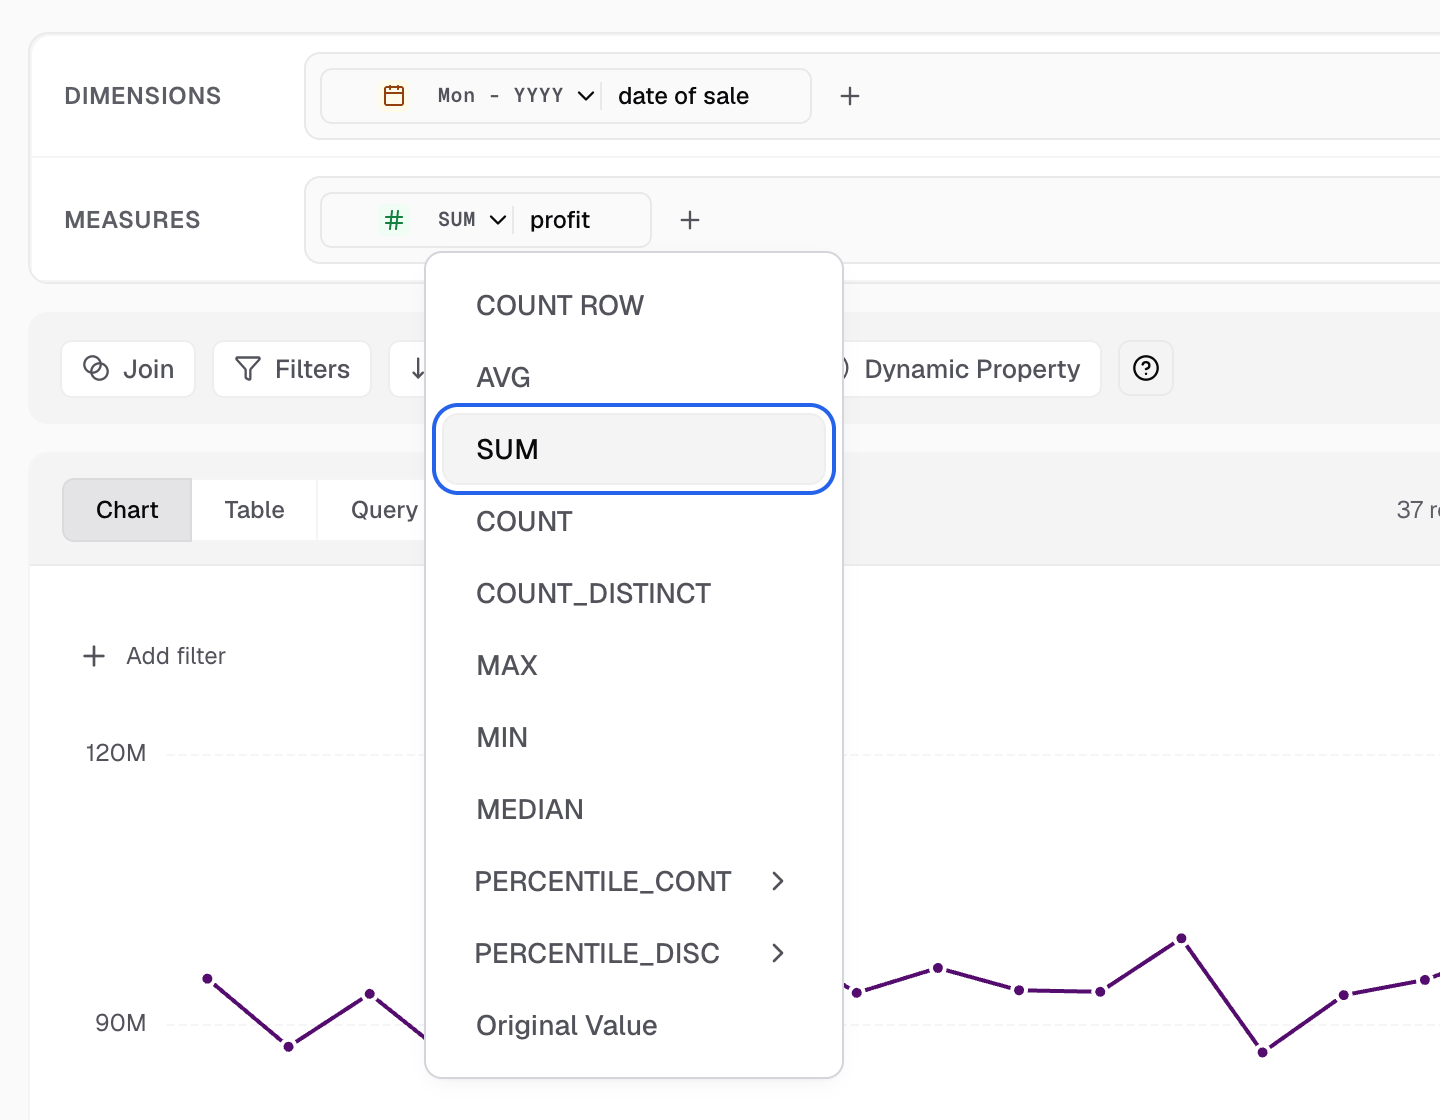
The badge menu lists the functions for the column. -
Select Chart type and choose a chart, for example Bar.
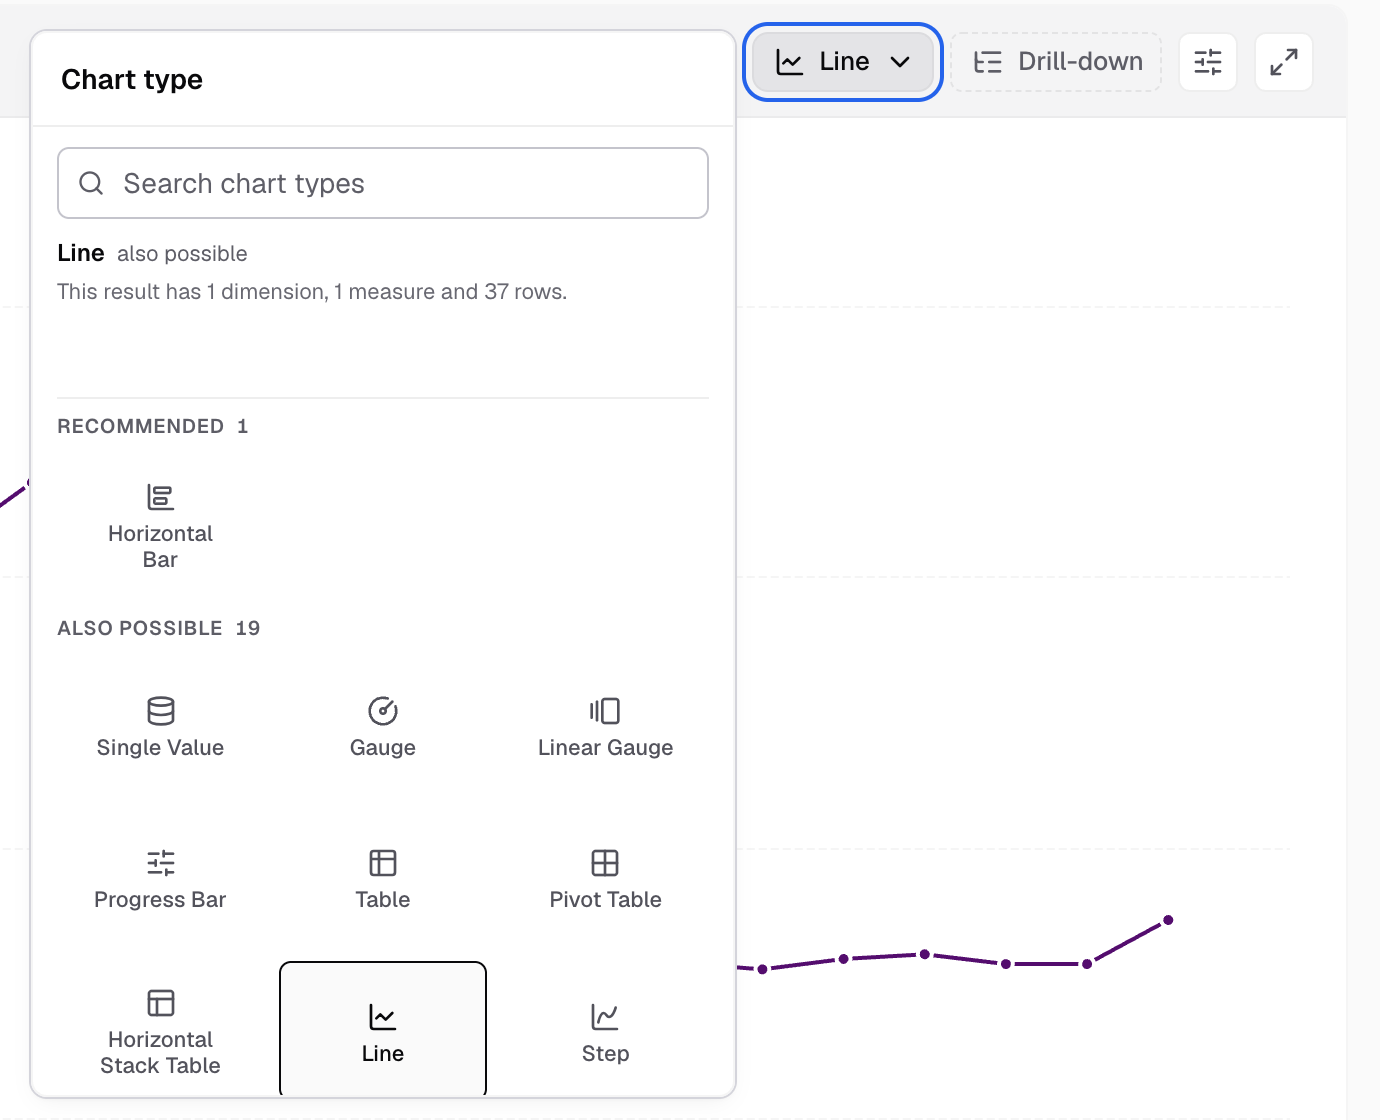
Chart type shows the recommended chart and the others that fit. -
Select Save to dashboard.

Save to dashboard is at the top right of the builder. -
In Dashboard, select one or more dashboards. To make one here, select New dashboard.
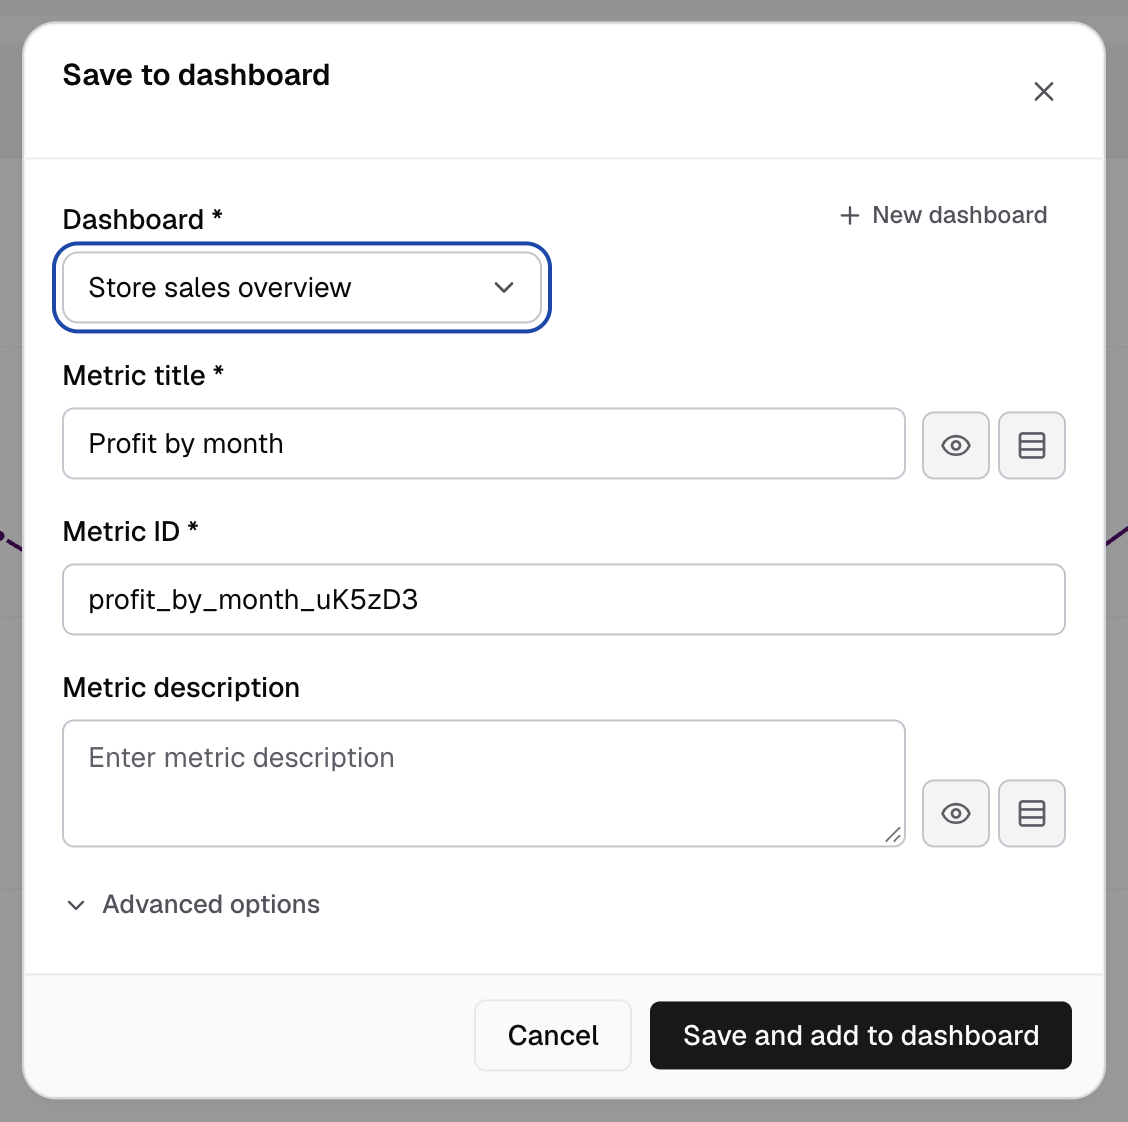
Pick the dashboards in Dashboard, or select New dashboard. -
Enter a Metric title, for example
Revenue by month.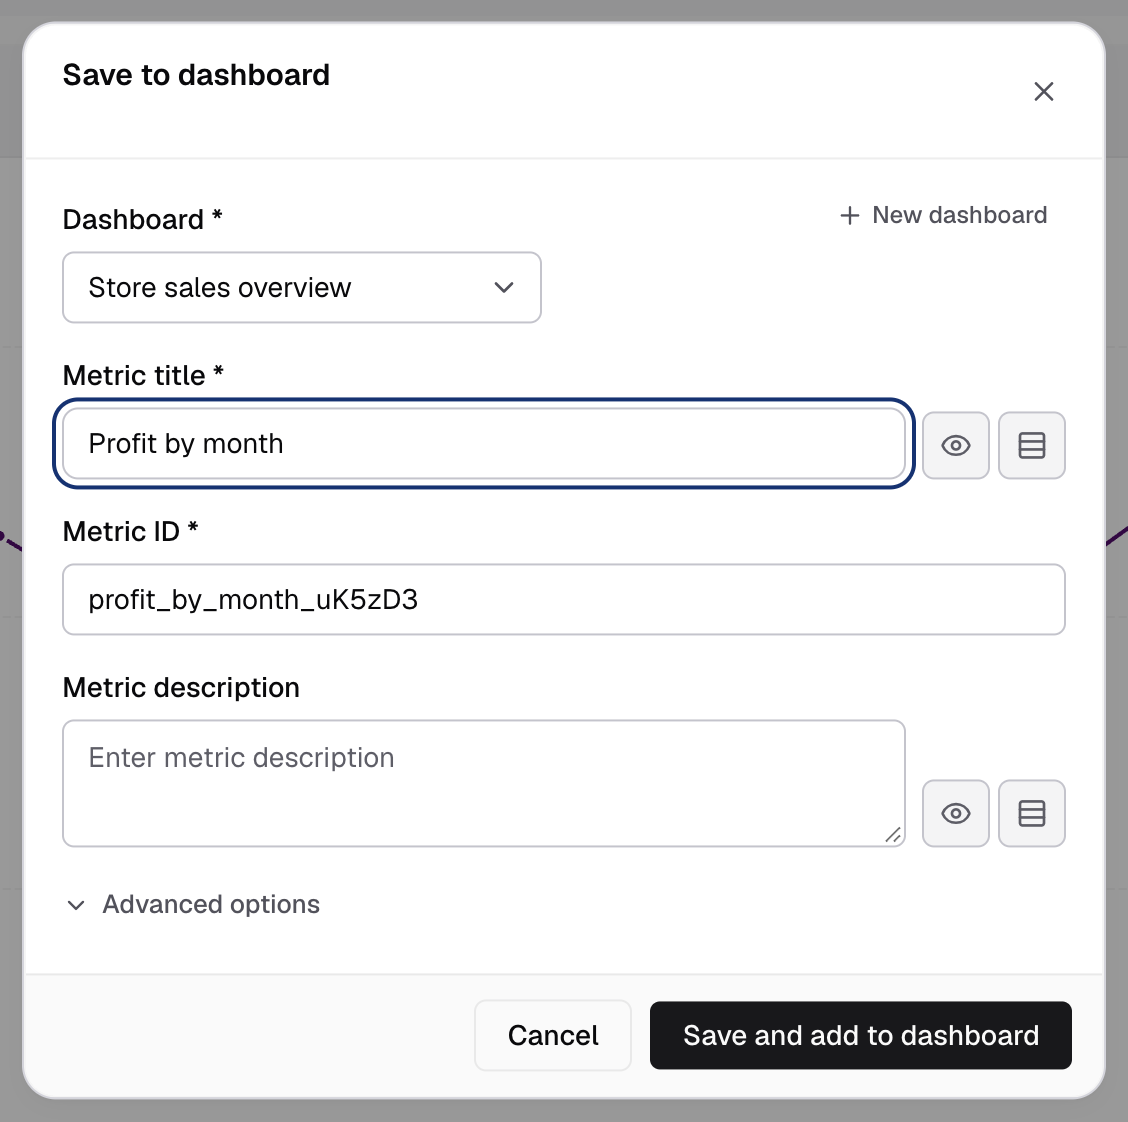
The Metric ID fills in from the title. -
Select Save and add to dashboard.
The metric is on the dashboard and the builder stays open on it. Next, edit the metric.
What is on the builder
| Area | What it does |
|---|---|
| Schema and SQL tabs | Pick columns from your tables, or write SQL. |
| Dimensions | The columns that break the data down, for example a date or a region. |
| Measures | The numbers you count or add up. |
| Calculated field | Add a column made from other columns. Add a calculated field |
| Join, Filters, Sort, Group By | Change the query. Join, filter, sort and group |
| Dynamic Property | Named values you use as [[name]] in SQL. Dynamic property |
| Row limit | How many rows the query returns. |
| Chart, Table, Query | Show the result as a chart, as rows, or as the SQL that runs. |
| Bryn | The AI assistant. Build a metric with Bryn |
On an empty canvas you can also select Ask Bryn to build it.
Functions on a field
Select the badge on a field to change it. A measure starts as SUM. A dimension starts as Original Value (badge VAL).
| Field type | In Measures | In Dimensions |
|---|---|---|
| Number | COUNT ROW, AVG, SUM, COUNT, COUNT_DISTINCT, MAX, MIN, MEDIAN, PERCENTILE_CONT, PERCENTILE_DISC | Round, Floor, Absolute, Ceil, Square root, Exponent, Log, Log 10, Distinct |
| Text | COUNT ROW, COUNT, COUNT_DISTINCT | Lowercase, Uppercase, Distinct |
| Date | COUNT ROW, COUNT, COUNT_DISTINCT | Date formats such as DD-MM-YYYY, Month - YYYY, Quarterly, YYYY, and Format Date |
- PERCENTILE_CONT and PERCENTILE_DISC ask for a Value between 0 and 1, for example
0.9. MySQL datasources do not show them. - Select the field name to set its Column Alias and Cast As (Integer, Decimal, Date, Default).
Row limit
Choose 10, 20, 50, 100, 200, 300, 400, 500, 1000, 3000, 5000 or 10000 rows. The default is 100.
For a top 50 list, sort the measure from high to low, then choose 50. Row limit is off for a table chart with server-side pagination.
Save dialog fields
| Field | Notes |
|---|---|
| Workspace | Shows only when the builder has no workspace yet. |
| Dashboard | One or more dashboards. With none selected, the button reads Save. |
| Metric title | Required. The eye and wrap icons hide or wrap the title on the card. |
| Metric ID | Required. Filled from the title, for example revenue_by_month_a1B2c3. You can change it. It must be unique. |
| Metric description | Optional. |
| What changed? (optional) | For a saved metric. Up to 200 characters. It shows in the version history. |
| Advanced options | Long description, Footnote (400 characters each), Allow end user to archive metric, Disable card stroke, Disable card shadow on hover. Footnote and long description |
To save the query as a dataset instead, select the arrow next to Save to dashboard, then Save as Custom Dataset.
Drafts and autosave
A new metric shows a Draft badge, and your work is kept as a draft. After the first save, the builder saves your changes on its own. The header shows Saving..., Saved, Unsaved changes or Couldn’t save.
To start again, select Start fresh, then confirm in Start a new metric?. This clears every field, filter, join and sort, and deletes the draft.
If something goes wrong
- New metric is missing. Connect a datasource first, or ask an Admin for the Editor role.
- Save to dashboard is greyed out. Point at it to see why, for example “Add a measure to save this metric.”
- This Metric ID is already in use. Enter a different Metric ID.