

Developers
Build a custom chart
Make your own chart type in the Chart studio, publish it, and use it in any metric.
Make a chart type of your own. After you publish it, it shows in the Custom group of every metric’s Chart type picker in your company.
Before you start
- You are an Admin. Only Admins see Custom charts in Settings.
- Your role has the metric Edit permission.
Make a chart in the Chart studio
-
Go to Settings > Developers > Custom charts. The page is at
/settings/custom-charts.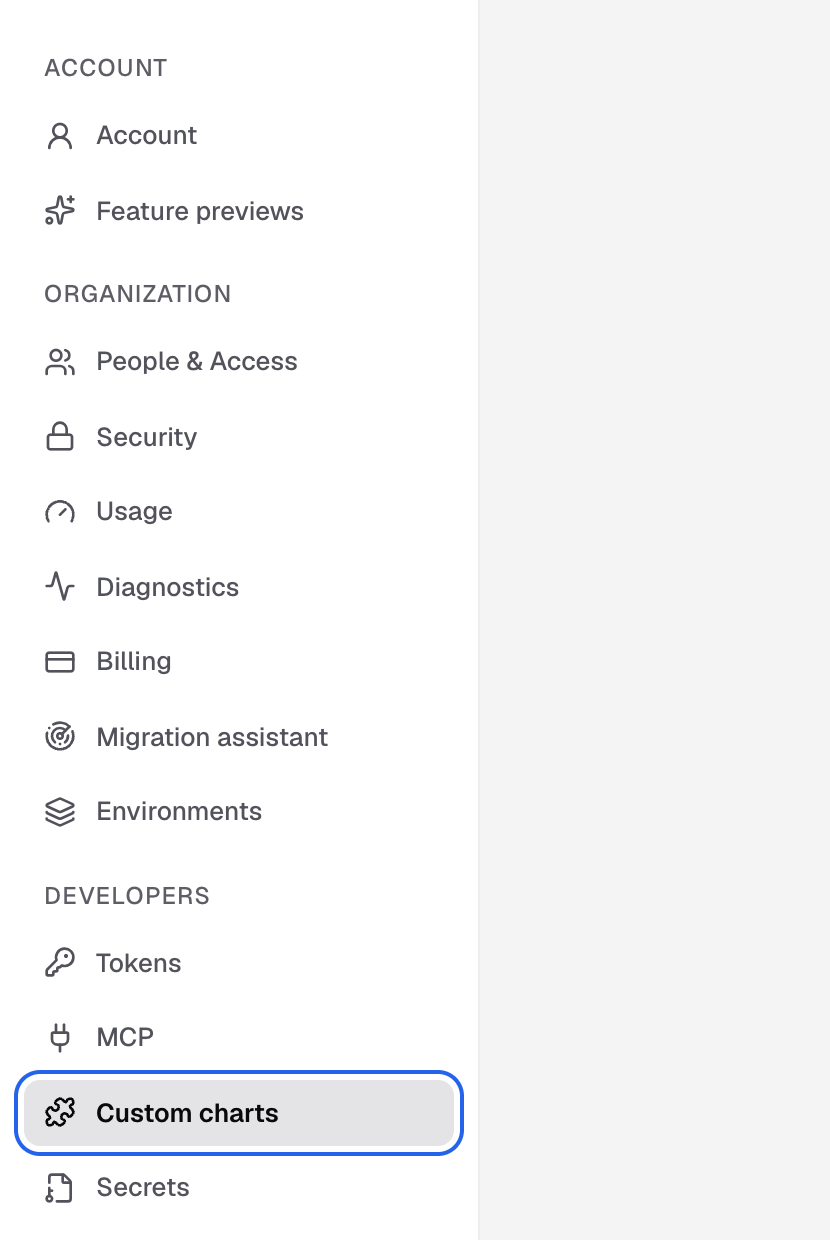
Custom charts is under Developers in the Settings sidebar. -
Select New chart.

New chart is at the top right of Custom charts. -
In New custom chart, start blank or choose a working chart.
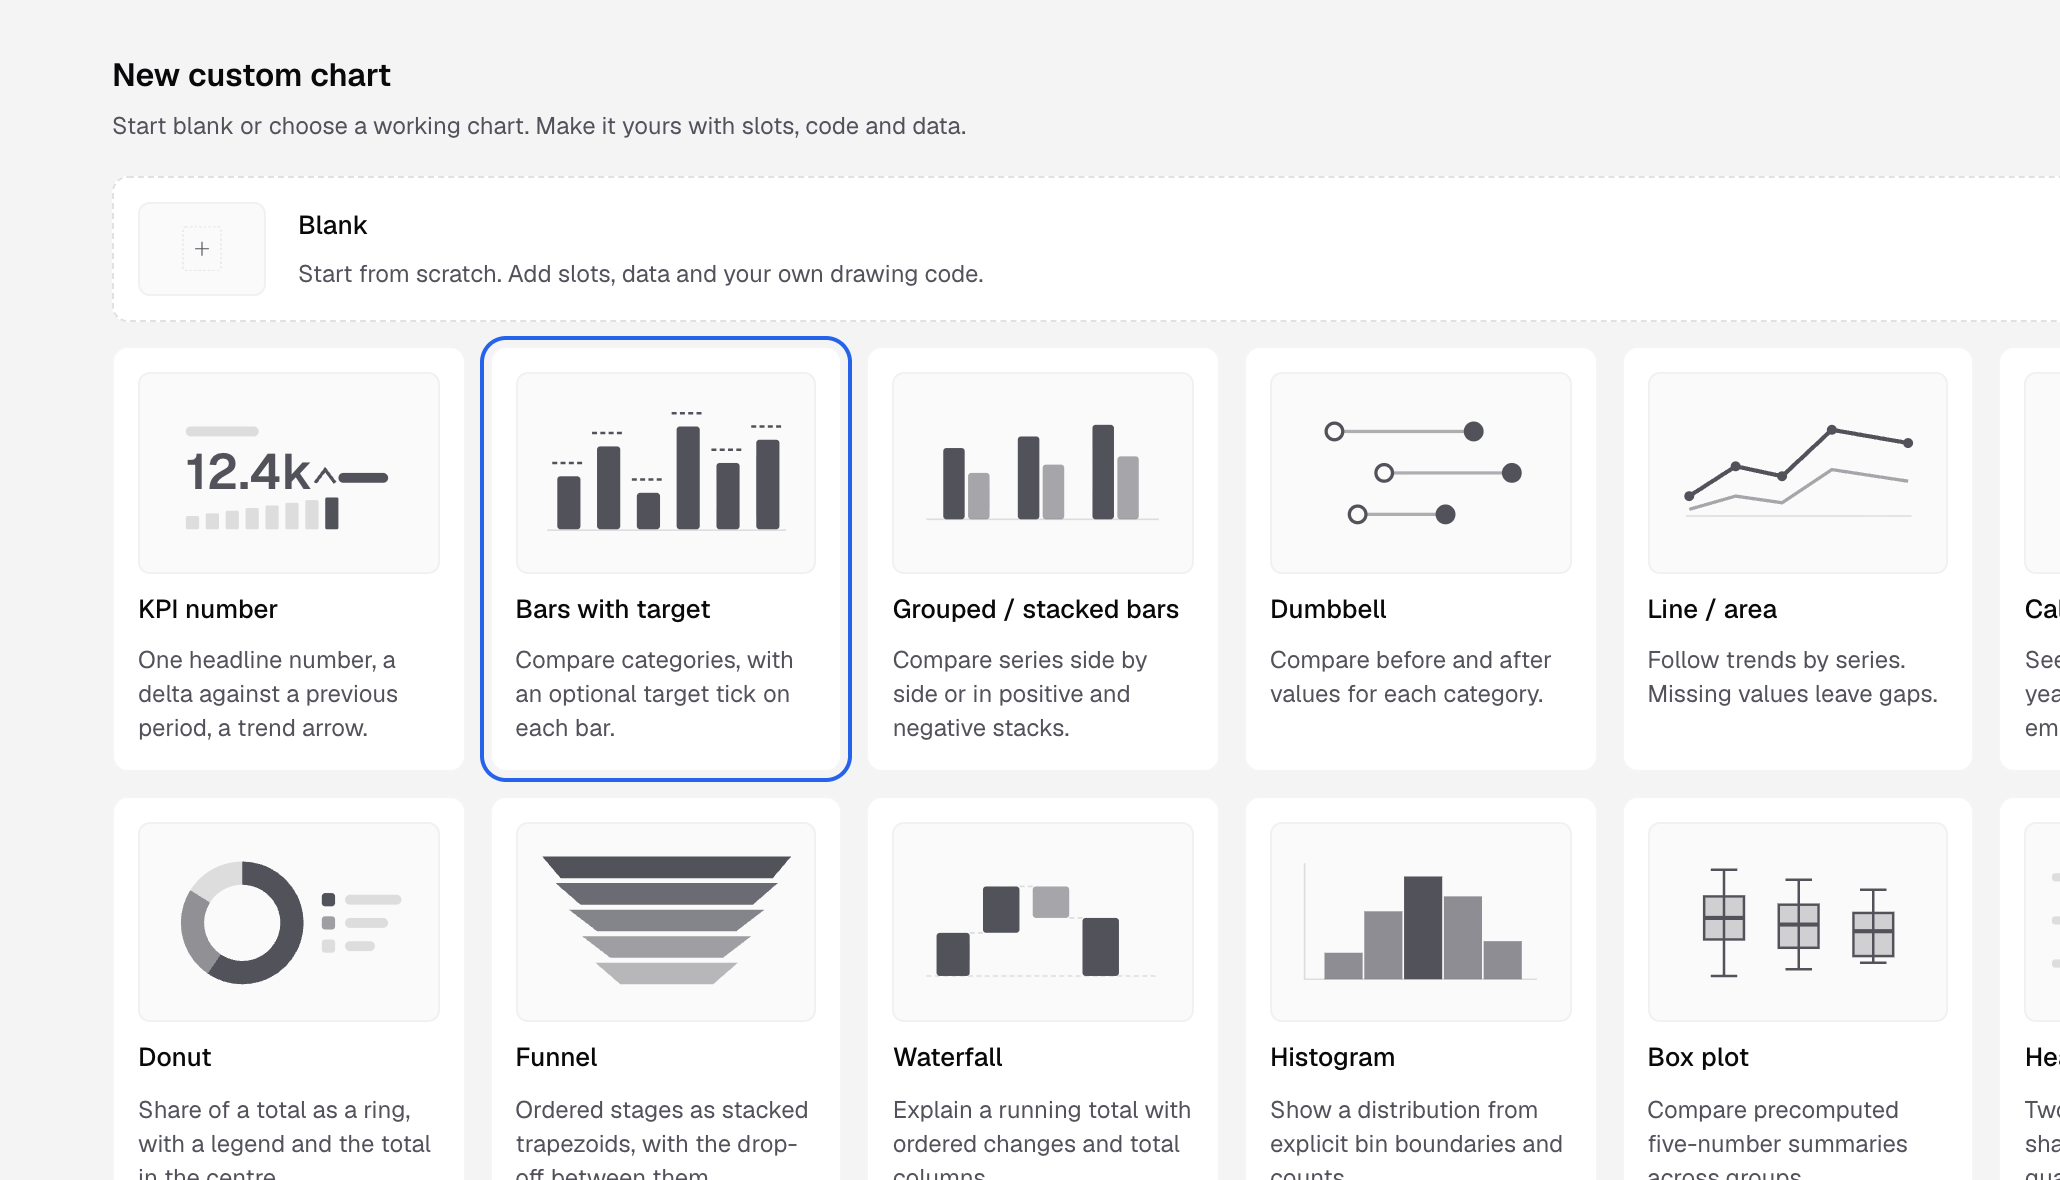
Start blank, or pick a working chart such as Bars with target. -
Enter a Chart name.
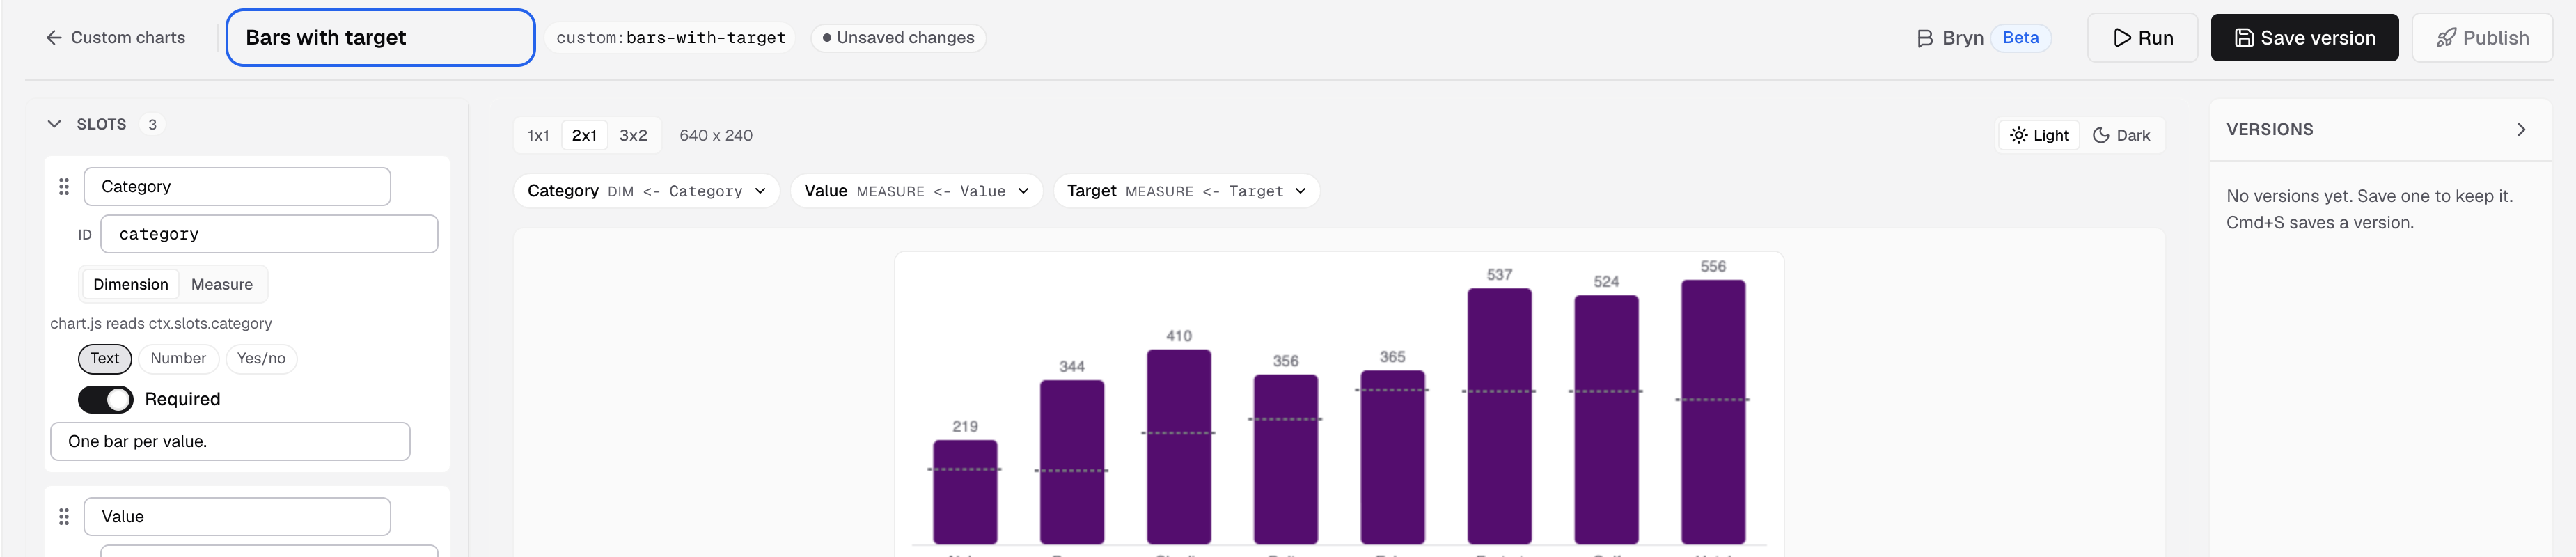
The chart name is at the top left of the studio. -
In the shape panel, add the data slots and options. A slot is a field the chart needs, for example a dimension for the label and a measure for the value.
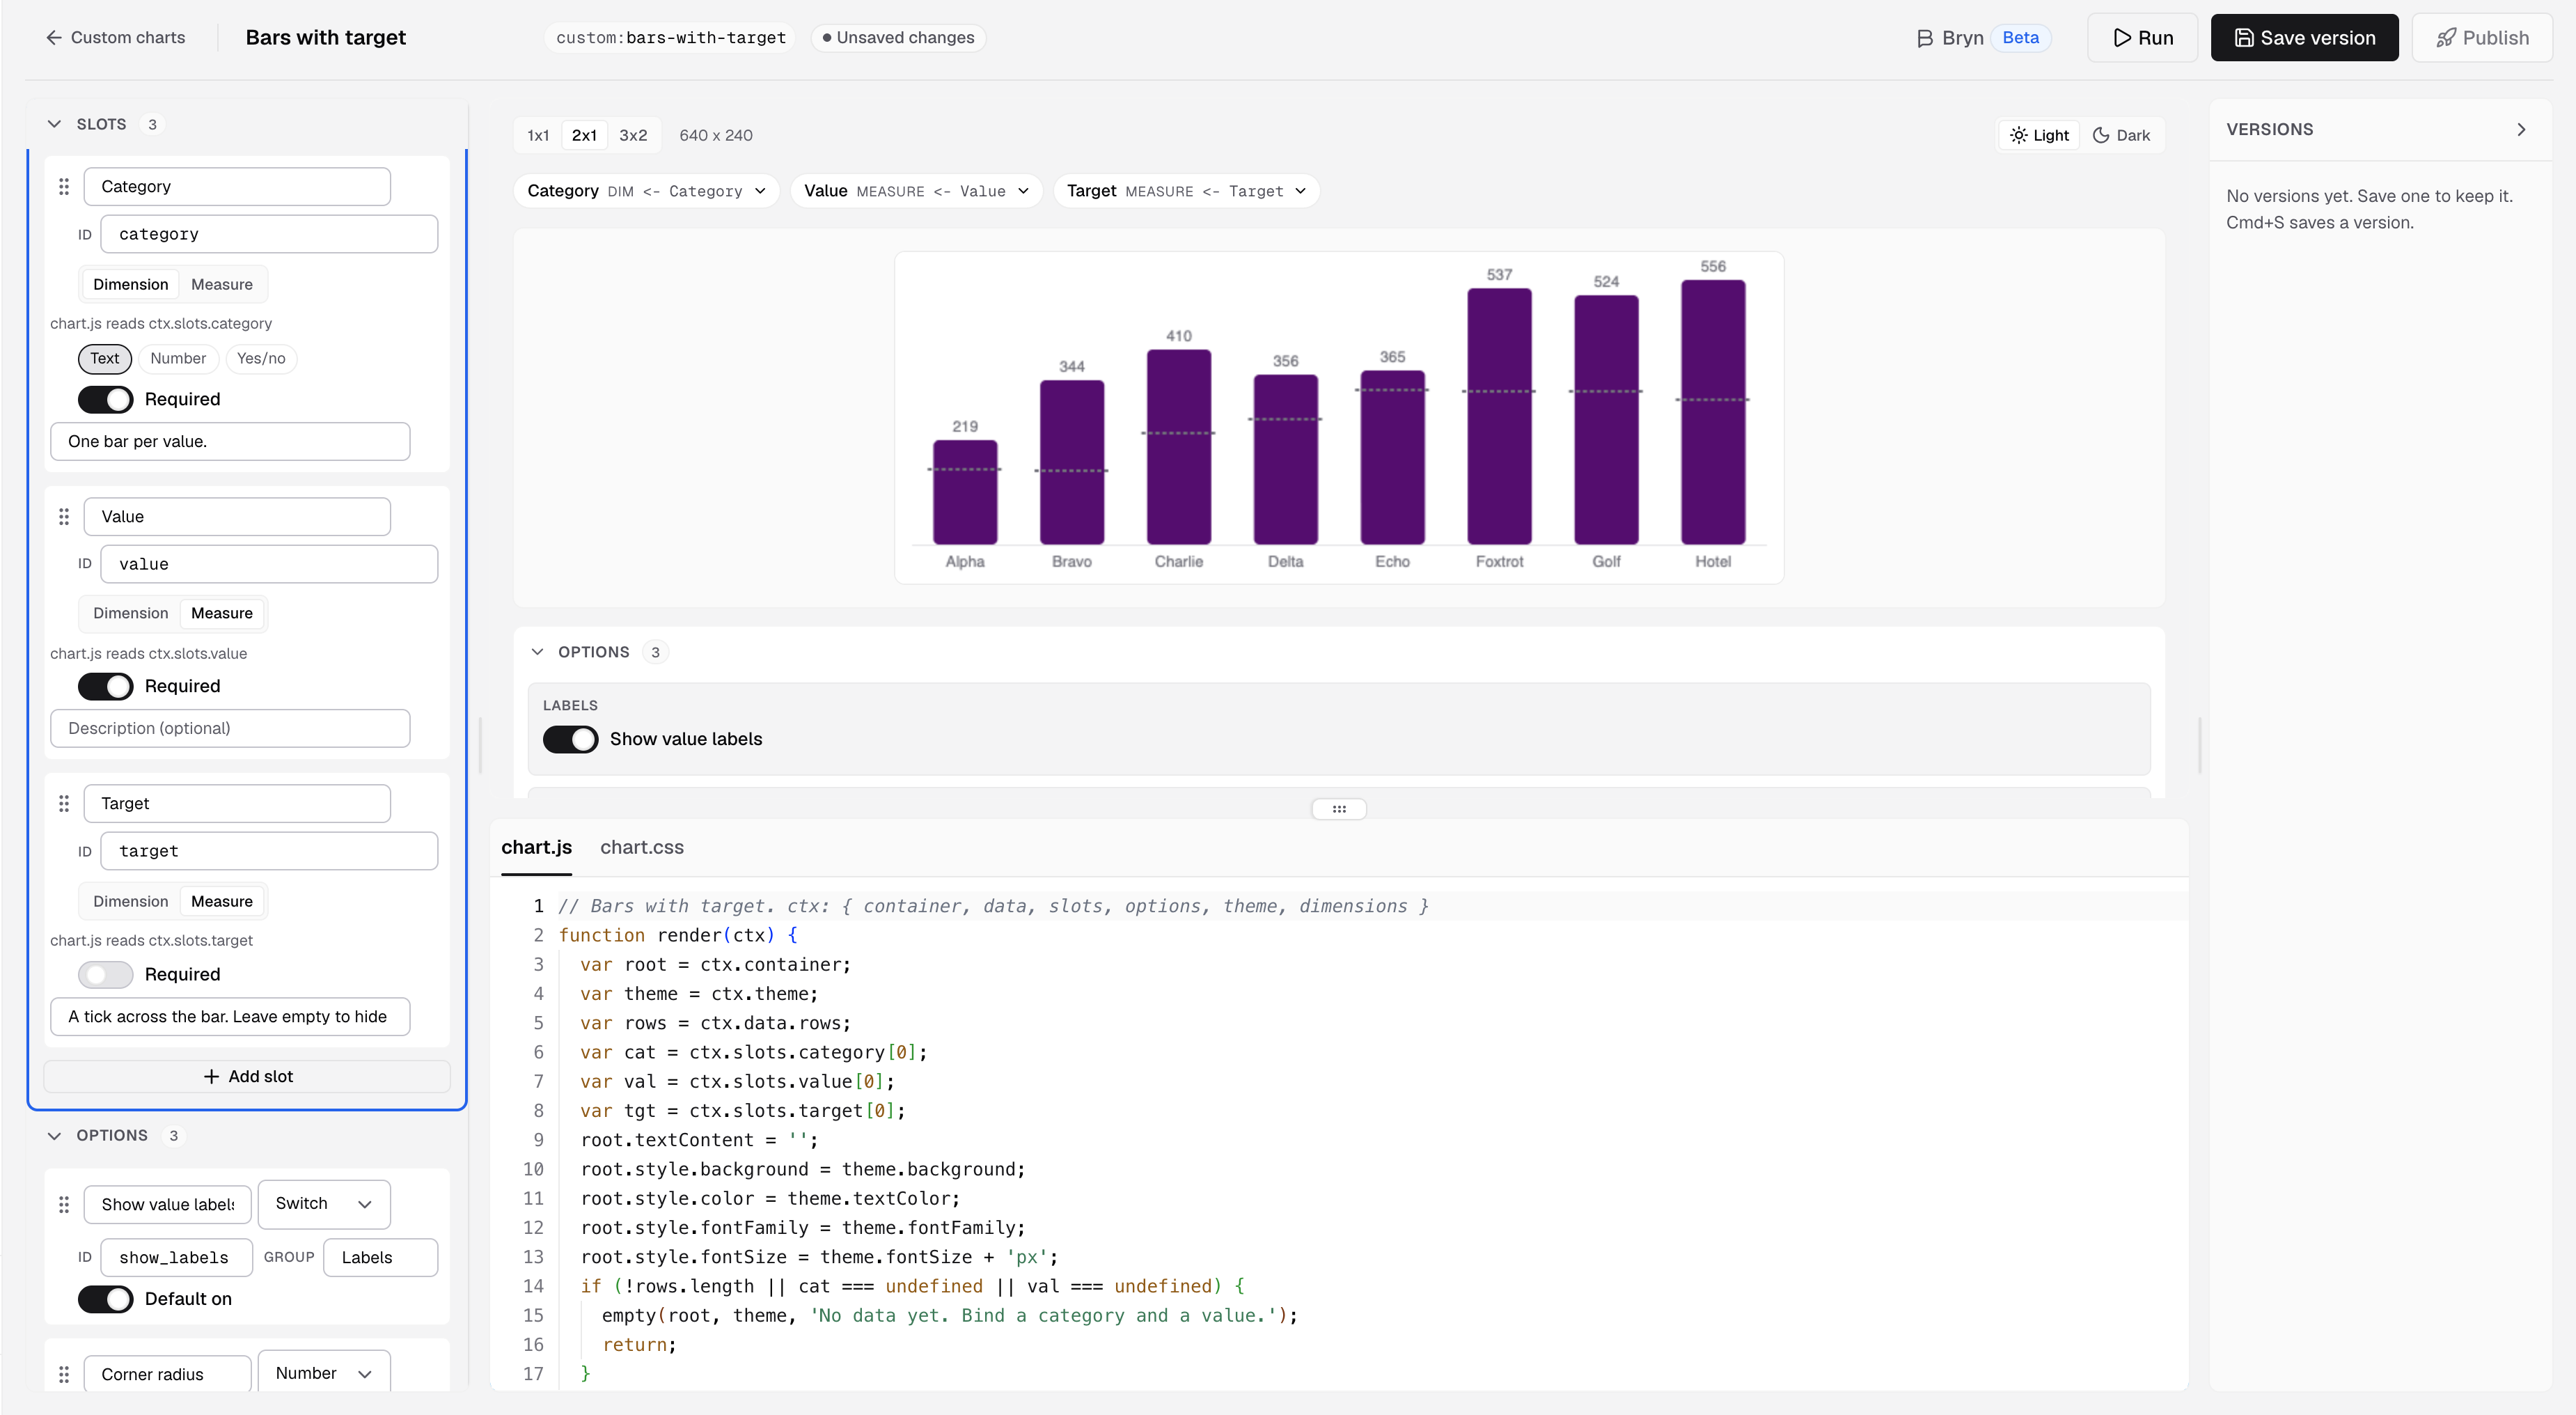
Slots are the fields the chart needs. Add slot adds one more. -
Edit the code in the
chart.jsandchart.csstabs.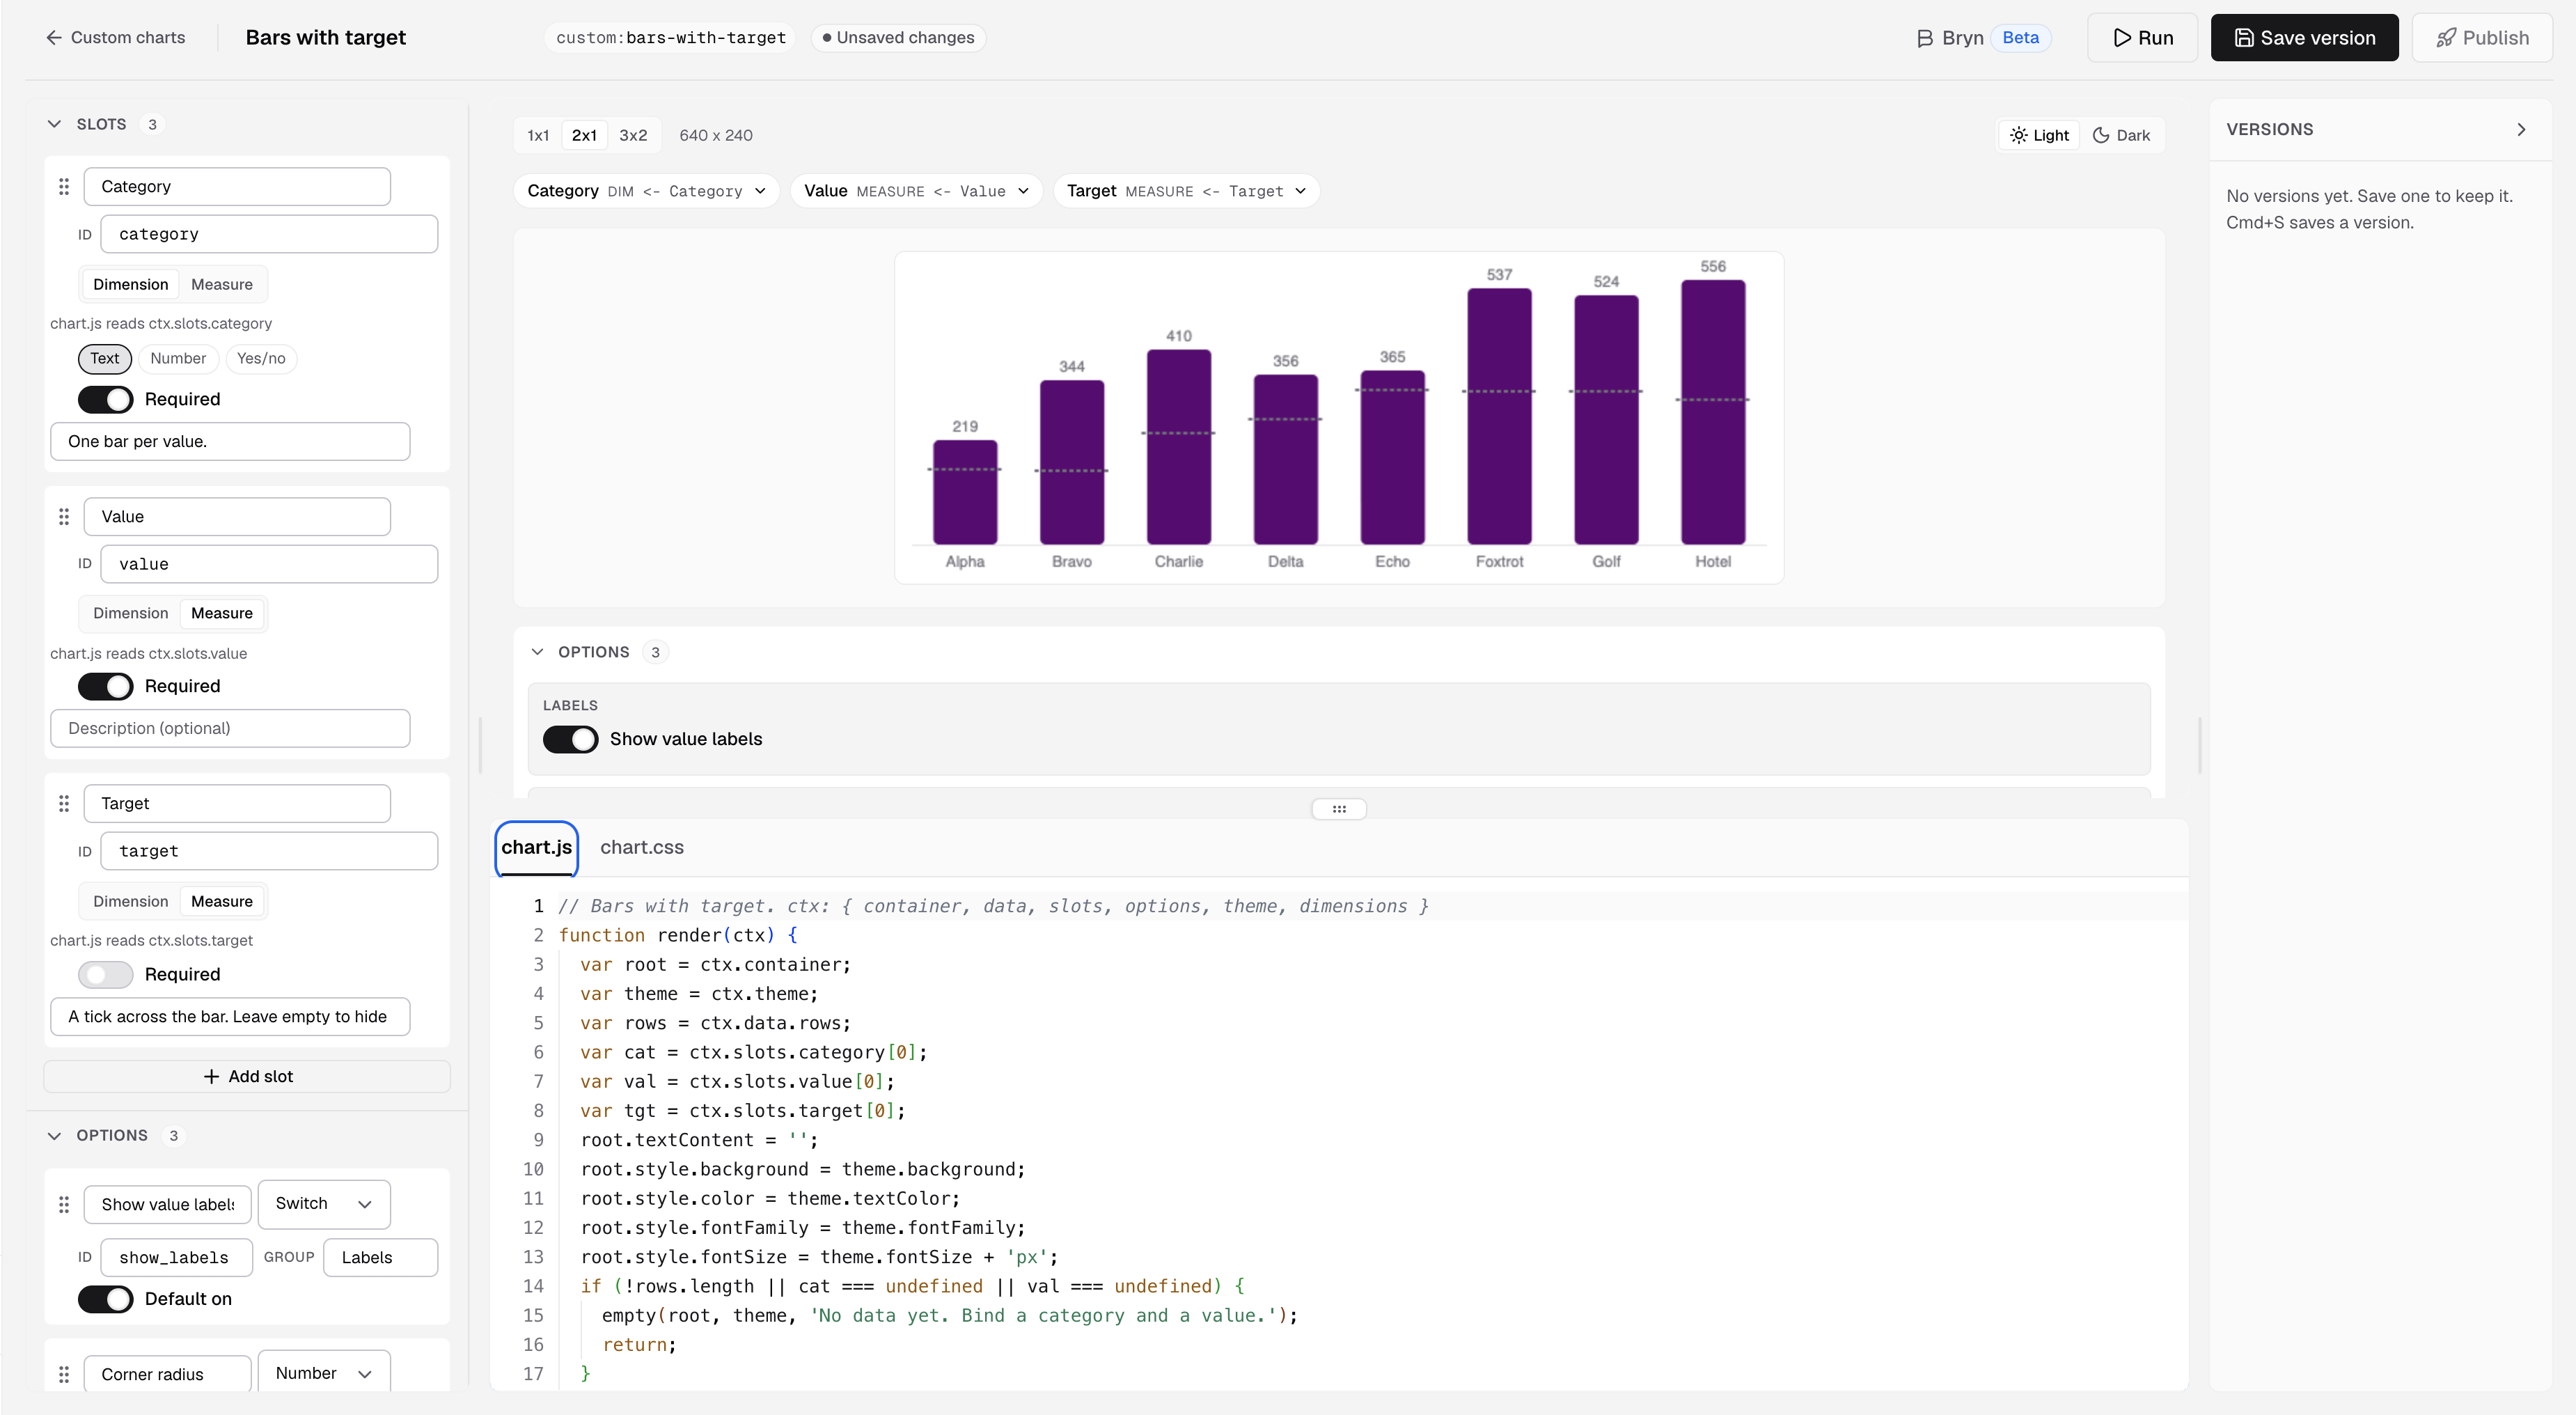
The chart.js and chart.css tabs are under the preview. -
Select Run to draw the chart with sample data.
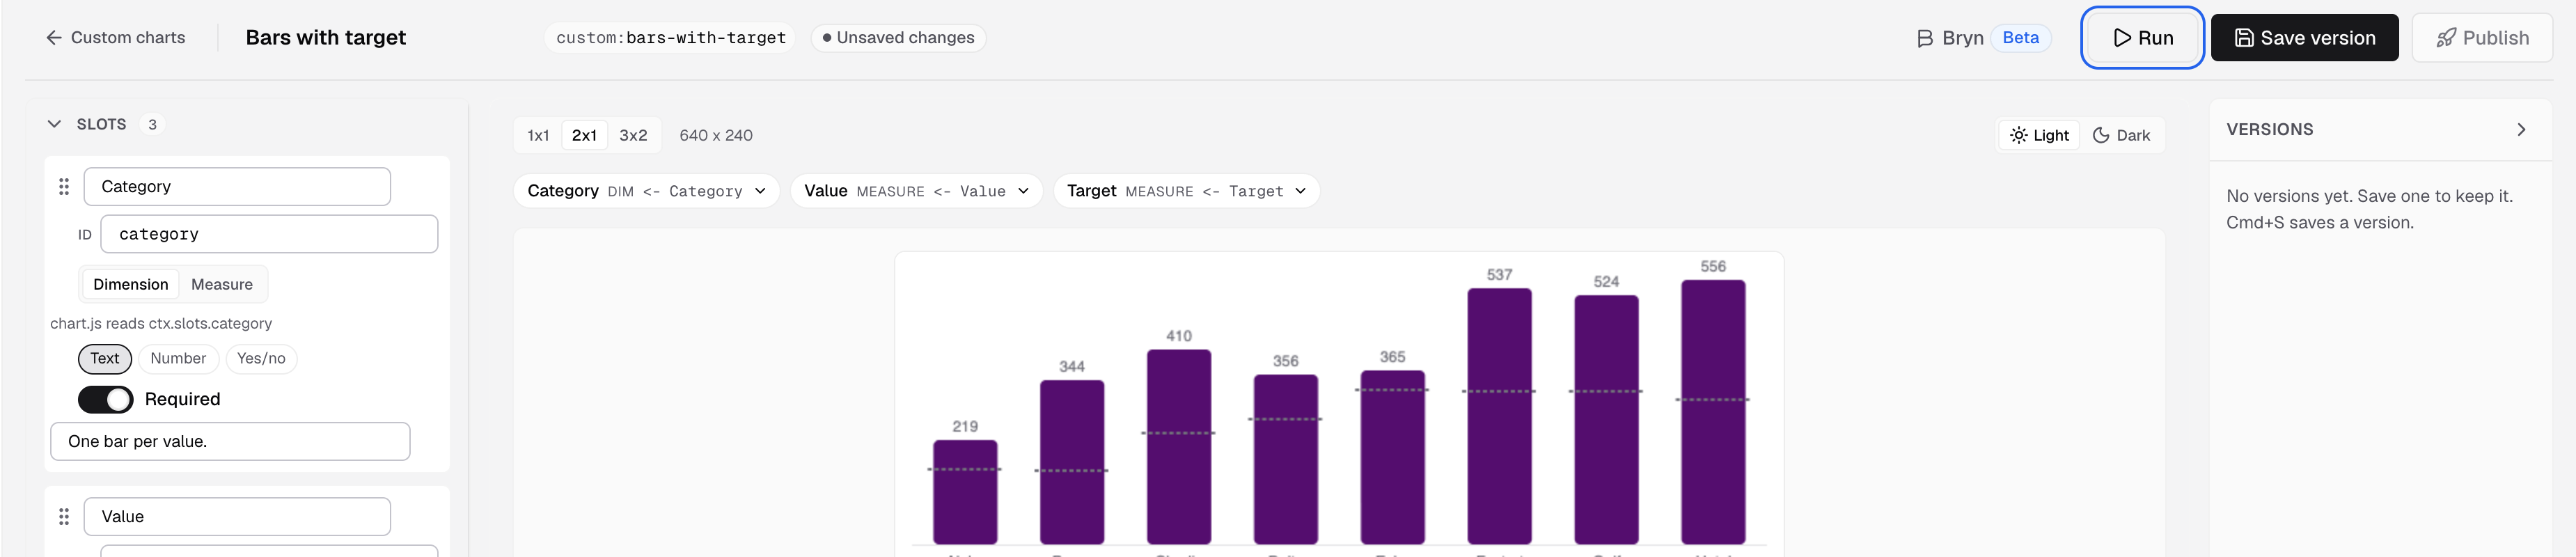
Run draws the chart with the sample data. -
Select Save version.
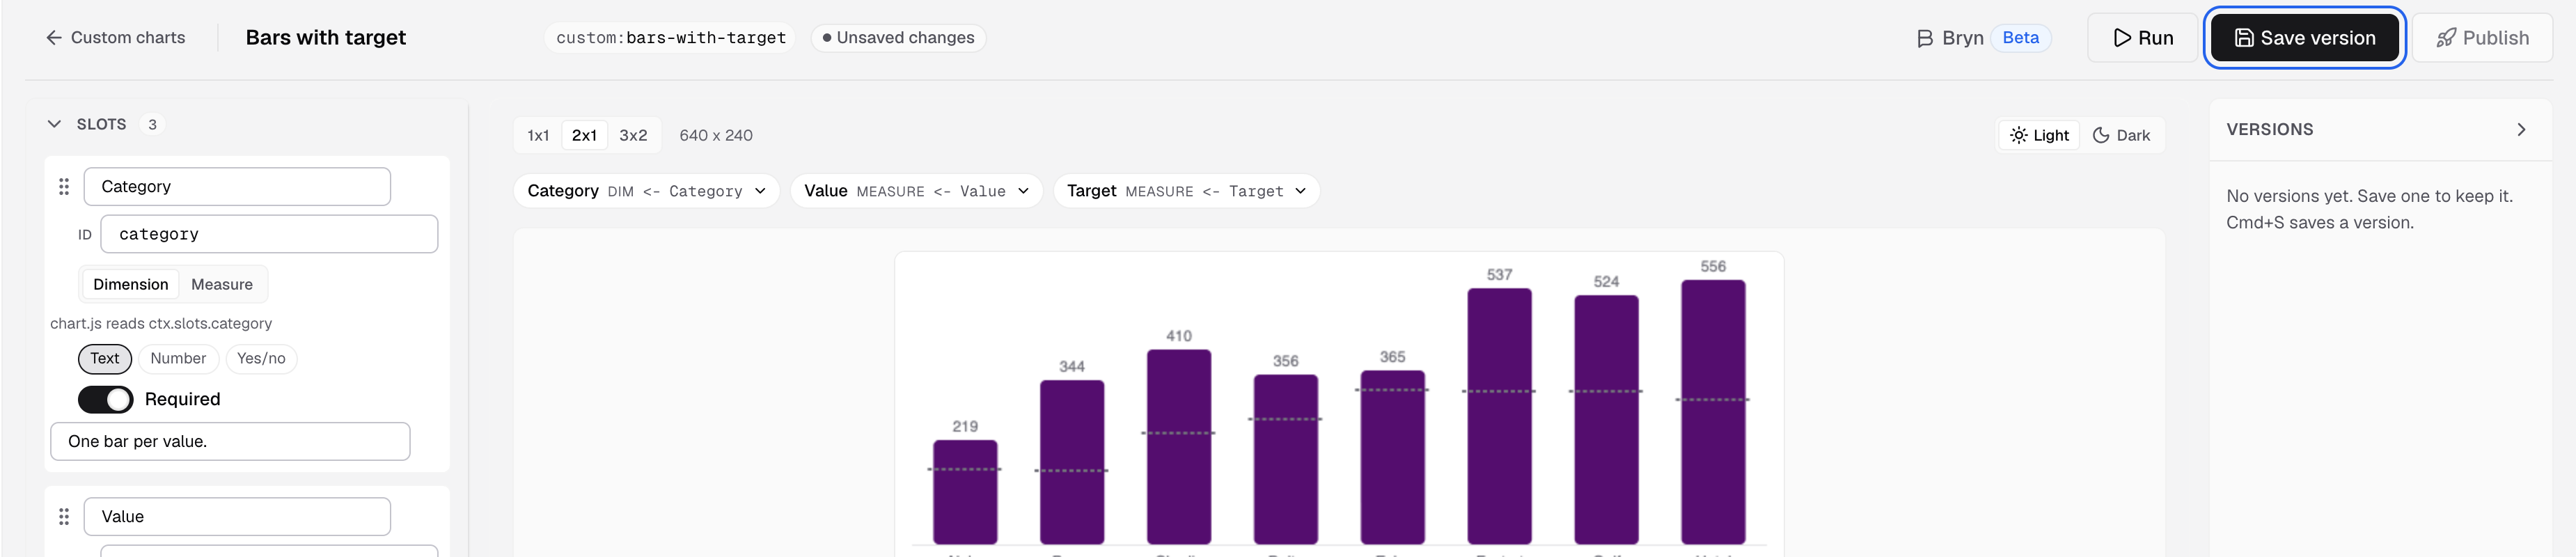
Save version keeps this draft as a preview version.
The version is saved as a preview. Nothing changes on a dashboard until you publish it. The studio for a chart is at /settings/custom-charts/studio/<chart key>.
Publish the chart
-
In the studio, select Publish. Or, on Custom charts, open the chart and select Publish preview.
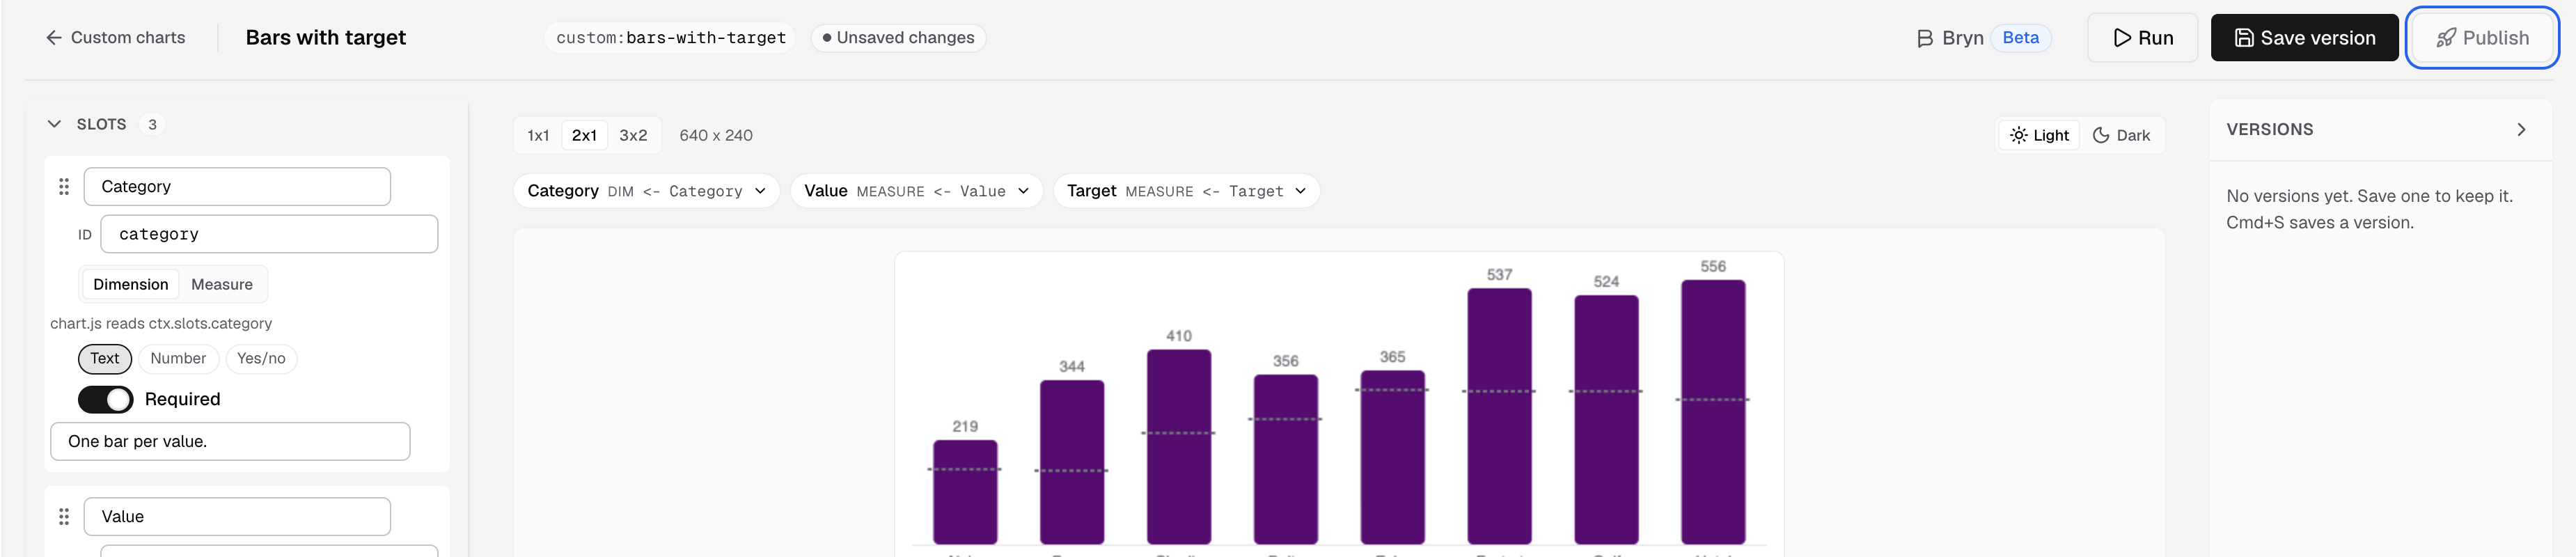
Publish is at the top right of the studio. -
Confirm. Every dashboard that uses the chart draws this version.
The chart is now a chart type in every metric editor in your company. To remove a preview you do not want, select Discard preview. The published version keeps running.
Upload a bundle instead
If you build the chart in your own code project, upload the build output.
-
Start a chart project with the CLI:
npx @databrainhq/mcp-server databrain custom-chart init my-chart -
Build the project.
-
Select Upload bundle.

Upload bundle is next to New chart. -
Drop
dist/bundle.zip, the four files fromdist/, or thedist/folder. -
Fix any problems the check lists, then select Upload.
The upload goes in as a preview. Publish it as above. The studio shows a chart built this way as Read-only: built with the CLI. Change its code in your project and upload a new version.
Use the chart in a metric
- Open a metric in the metric builder.
- Select Chart type, then pick your chart in the Custom group.
- In Chart settings, bind your fields to the Data slots.
- Set the Options.
- Save the metric.
A metric with a published custom chart also draws it in embedded dashboards. Embedding is on the Enterprise plan.
Ask Bryn in the studio
Select Bryn in the Chart studio and describe a change, for example “Show percentages on the arcs”. Bryn edits chart.js, chart.css, the slots, the options and the sample data in your draft, then runs the chart. You still save the version and publish. Select Undo this or Restore to before Bryn to go back.
Limits
| Item | Limit |
|---|---|
Chart code (dist/index.js) | 2 MB |
chart.css | 256 KB |
icon.svg | 16 KB, with no scripts |
manifest.json | 32 KB, up to 16 slots and 32 options |
| Versions per chart | 50 |
If something goes wrong
- “You need the metric Edit permission to change custom charts.” Ask an Admin to give your role the metric Edit permission.
- “This exact bundle is already v…” You uploaded the same bundle again. Nothing changed.
- “Add a data slot before saving a version.” Add at least one slot in the shape panel.
- “Custom chart … already has 50 versions” Discard its preview version to make room.
- Your chart is not in the Custom group. It is not published yet. Publish it first.
Next: pick a chart type.