

Chart appearance
Settings for each chart type
Find the Chart settings sections that only some chart types have.
Some chart types have their own sections in Chart settings. Find your chart below.
To open the panel, select Appearance in the chart toolbar. Change how a chart looks
Single Value
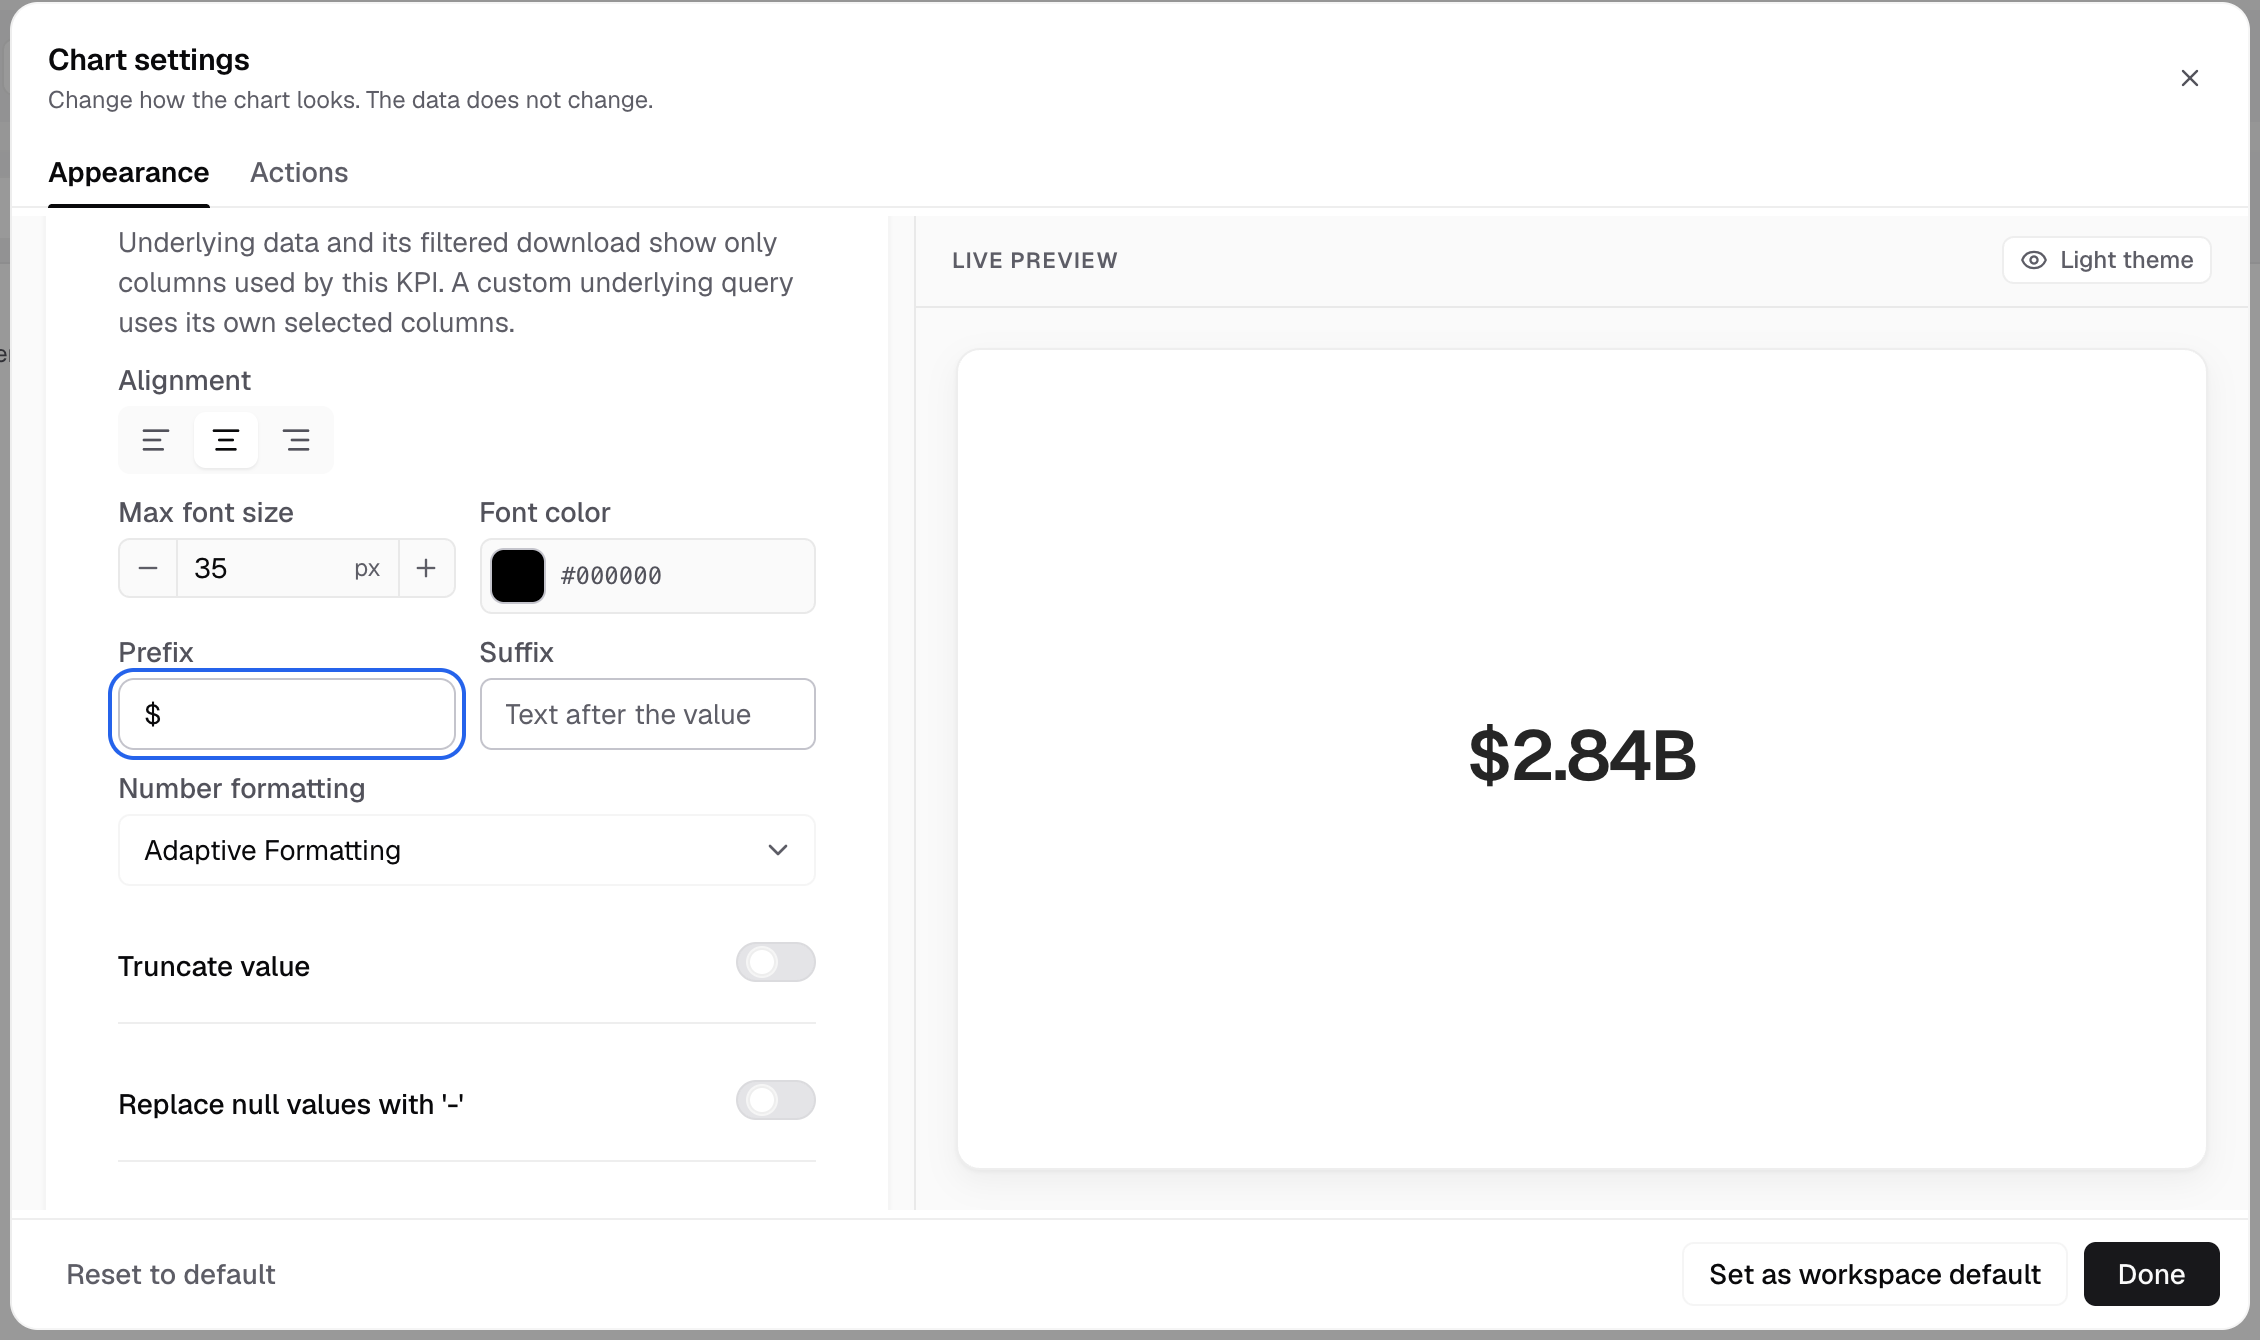
Number format and Field formats are at the top. Then:
| Section | What you set |
|---|---|
| Customizations | Alignment, Max font size, Font color, Prefix, Suffix, Truncate value, Date formatting, null values, Customize sub-header |
| Comparison value | Compare the value with an earlier period. Shows only when the metric can compare. |
| Conditional formatting | Change the font color of the value when it meets a rule |
| Card color | A background color for the card |
Table, Pivot Table, Horizontal Stack Table and Trend Analyzer
Number format is at the top. Then:
| Section | Charts | What you set |
|---|---|---|
| UI styling | All four | Title, header, text wrap, content font, list, badge and trendline columns, dividers, search, striped rows, borders |
| Conditional formatting | Not Pivot Table V1 or V2 | Color the cells whose values meet a condition |
| Formatting | Table, Horizontal Stack Table, Pivot Table V2 and V3 | Number, prefix, suffix and date format per column |
| Aggregate row | Table | A total row |
| Bar styling | Horizontal Stack Table | Bar width, Top radius, Bottom radius |
| Features | Table, Trend Analyzer | Pagination, Table search, Sorting, Column filters, View details, Transpose data |
| Custom settings | Pivot Table V2 | Striped rows, Sorting, All level sorting |
Gauge, Linear Gauge and Progress Bar
| Chart | Sections |
|---|---|
| Gauge | Marker, Legend, Chart colors, Formatting |
| Linear Gauge | Chart markers, Labels, Legend, Chart colors, Formatting |
| Progress Bar | Chart markers, Labels, Legend, Chart colors, Limits, Formatting |
Limits sets an Upper limit and Lower limit, each with a bar color and an alert message.
Pie, Doughnut and Rose
- Features is called Other customizations. It has View by measure. Rose adds Rose type. Pie and Rose add Selection mode and Selection offset.
- Advanced > Chart label adds Show dimension label, Show label line, Dynamic label position and Show actual value label.
- There are no axes, no Chart margin and no Chart tooltip settings.
Combo charts
Combo (Multi-Scales) and Horizontal Combo (Multi-Scales) have Combo chart settings. Put measures on shared axes and choose a bar or a line for each axis. They have no Formatting section. Combo charts
Other charts
| Chart | What is different |
|---|---|
| Waterfall | Chart colors is called Waterfall settings: Use measure as, limits, Total column, Increase color, Decrease color |
| Tree map | Chart colors has Min, mid and max colors. No axes, legend, label, margin or features. |
| Time Series | Features has the time series block: Series type, Group format, Fill X-axis |
| Sankey | Features has Swap source and target and Switch measure |
| Network | Features has Repulsion |
| Funnel | No chart settings panel. Appearance is greyed out. |
Custom charts
A custom chart does not use these tabs. Its panel has Data slots and Options, set by the chart’s author. Build a custom chart
Next: set up a chart type.