

Metrics
Add an AI summary to a dashboard
Add a card that writes a short AI summary of the metrics you pick.
The summary is a dashboard element called Metric Summary. It reads the data of the metrics you pick and writes text, such as trends, anomalies and actions to take.
Before you start
- Your company is on the Business plan or higher.
- The workspace has a semantic layer: it is linked to a datamart, and its columns have descriptions.
- Your role has Create on Elements. Admins have it by default.
- The workspace has an AI model, or uses Databrain’s model.
Turn on summaries for the workspace
- Go to Home and select Workspace settings.
- In Metric summary, turn on Summarise metric data.
- Select Save changes.
Add the summary to a dashboard
-
Open the dashboard.
-
Select Add element.

Add element is the third icon in the dashboard toolbar. -
In Element Type, select Metric Summary.
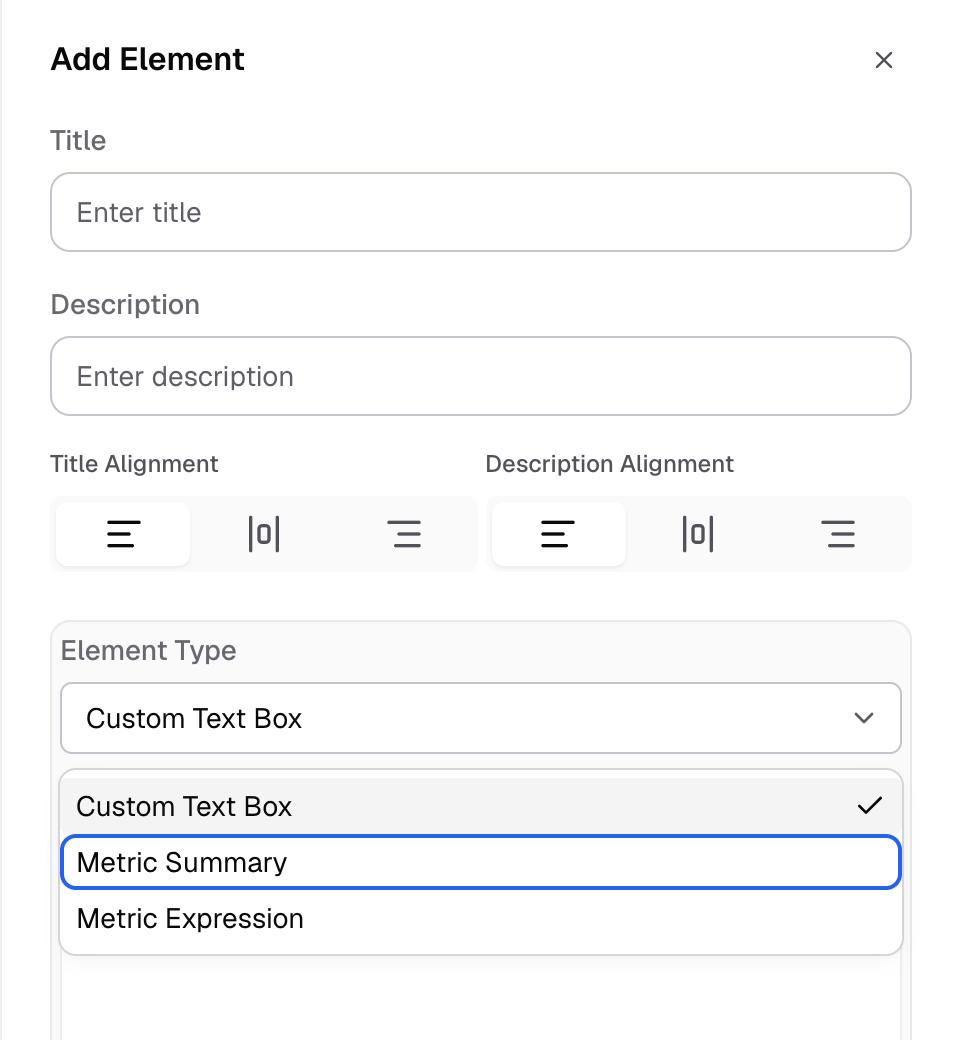
Metric Summary is in the Element Type list. -
Optional: enter a Title and Description.
-
In Metrics, select the metrics to summarize.
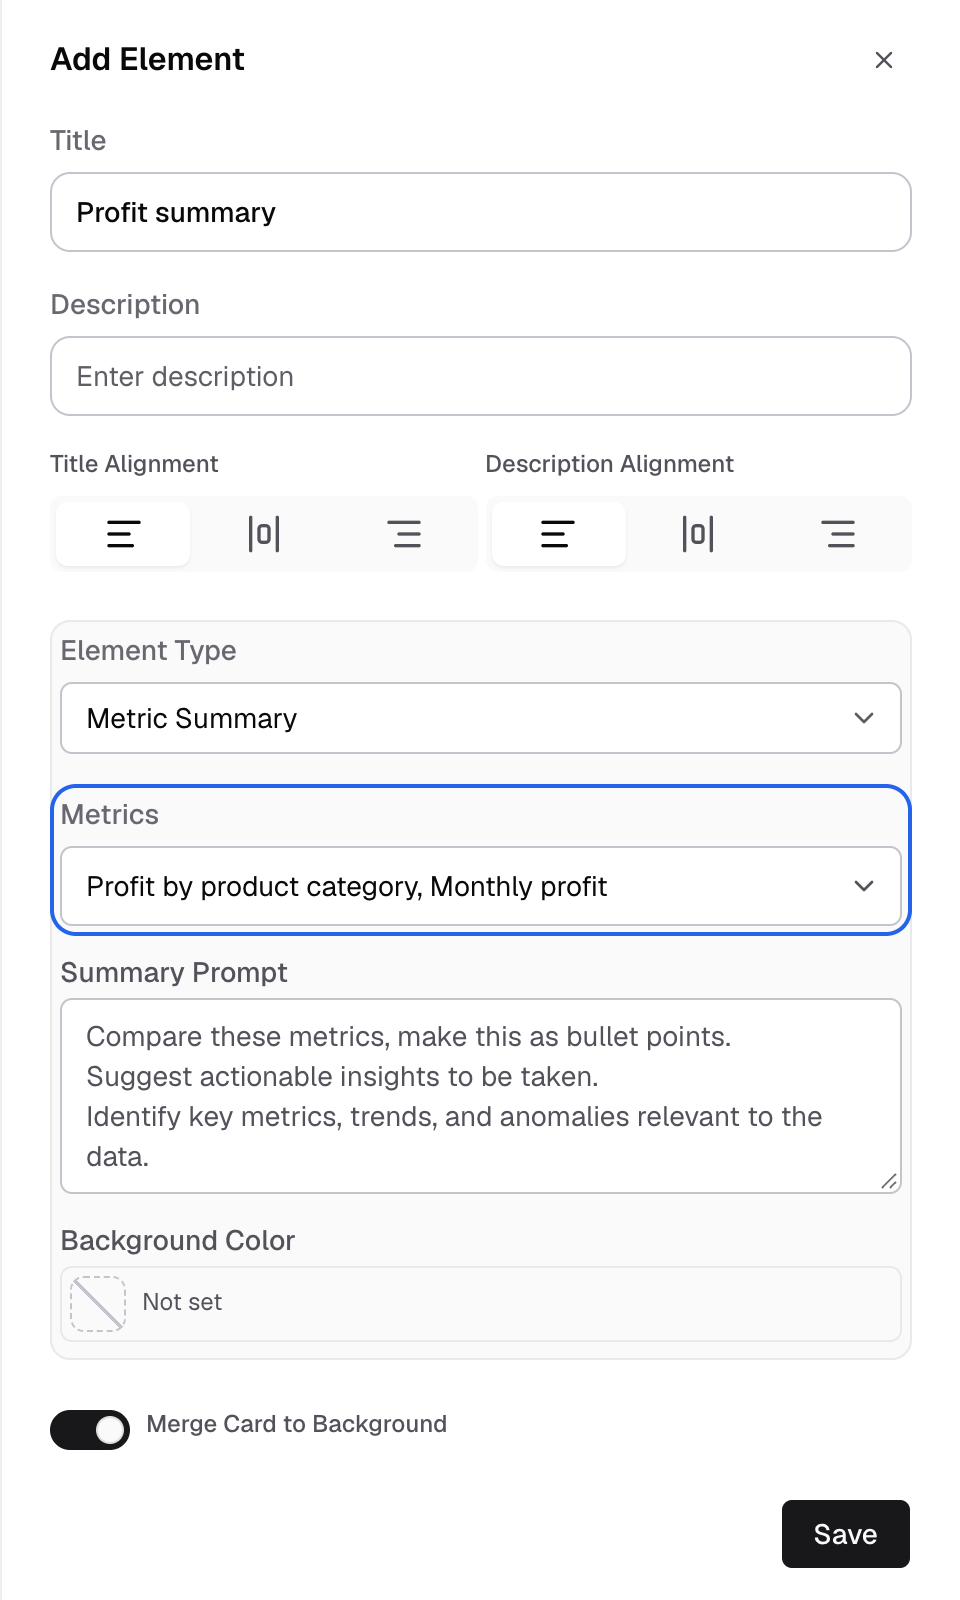
Pick the metrics the summary reads. -
Optional: change the Summary Prompt. The default asks for bullet points, actionable insights, key metrics, trends and anomalies.
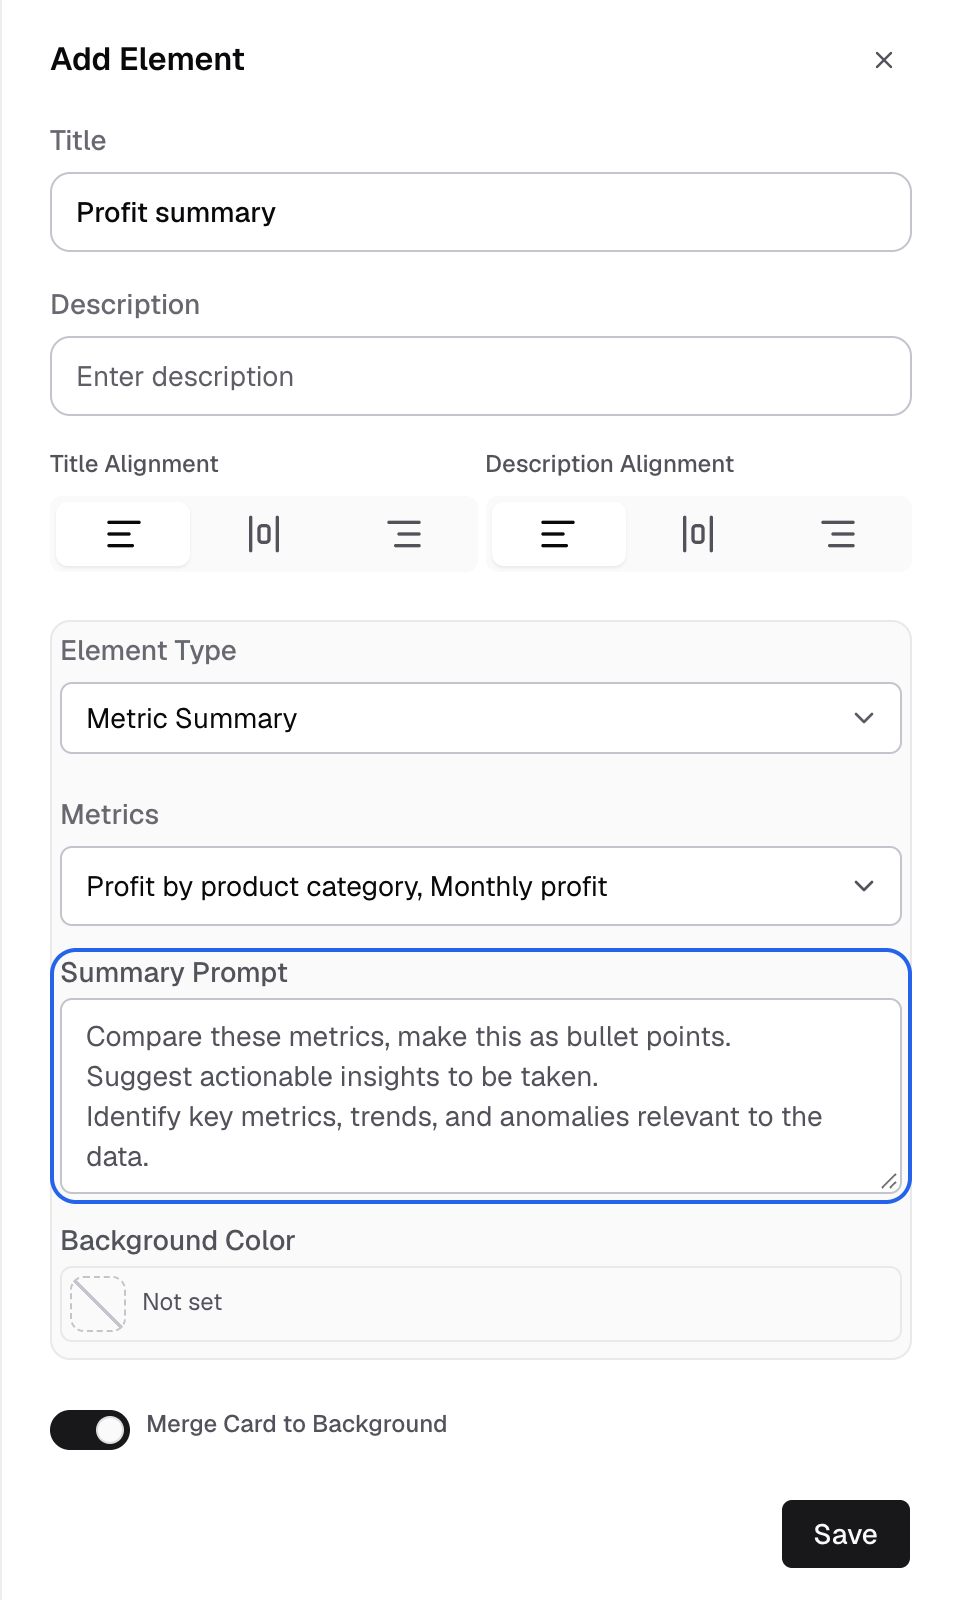
The default Summary Prompt asks for bullet points, insights, trends and anomalies. -
Optional: select a Background Color.
-
Select Save.
The card writes the summary when its metrics have data. Select Copy summary to copy the text.
Databrain keeps a summary for 7 days. It writes a new one when the data or the filters change.
Limits
When the workspace uses Databrain’s model, your company can make 200 summaries per day (UTC). Embedded viewers need your own AI model. They cannot use Databrain’s model.
If something goes wrong
- Metric Summary is not in Element Type. Turn on Summarise metric data in Workspace settings.
- Summarise metric data is greyed out. The workspace has no semantic layer, or your plan does not include AI summaries.
- There is no data to summarize. The picked metrics have no rows. Check the filters.
- This needs your own AI model here. Add one in AI settings. (
METRIC_AI_OWN_MODEL_REQUIRED) An embedded viewer opened the summary and the company has no model of its own. - Databrain AI is off for your organization. An admin can turn it on in Settings, LLMs, or you can connect your own model. (
METRIC_AI_CONSENT_REQUIRED) An Admin turns on Databrain’s model in Settings > LLMs, or adds a model. - Databrain AI is not available for your company. Add your own model in AI settings. (
METRIC_AI_NOT_OFFERED) Add your own model. - Databrain AI is not available right now. (
METRIC_AI_UNAVAILABLE) Try again later. - Your company reached today’s limit for Databrain AI summaries. Try again tomorrow, or add your own model. (
METRIC_AI_DAILY_LIMIT) The 200 per day limit is used up. - This could not be written. Try again. (
METRIC_AI_FAILED) Reload the dashboard. - Summaries are in use on dashboards in this workspace. Delete them before turning this off. Delete the Metric Summary cards first.