

Quick Start
Create your first metric
Chart one question from your data and save it to a dashboard.
The video creates a workspace from a new datasource, builds a metric from two fields and saves it to a new dashboard.
Before you start
- You have a workspace with a datasource. If not, connect data and create a workspace.
- Your role lets you create metrics.
Open the metric builder
- Go to Home and select your workspace.
- Select New metric.
You can also select Create metric on any dashboard. The builder opens as Untitled Metric with a Draft label.
Build it from fields
You pick the columns. No SQL needed.
- In the Schema list, open your table. To find a column, use Find a table or column.
- Double-click a text or date column, such as
region. It goes to Dimensions: what you break the data down by. - Double-click a number column, such as
amount. It goes to Measures: what you add up.
You can also drag a column into Dimensions or Measures.
The builder runs the query and draws a chart. A measure starts as SUM. Select SUM to pick another one, such as COUNT or AVG.
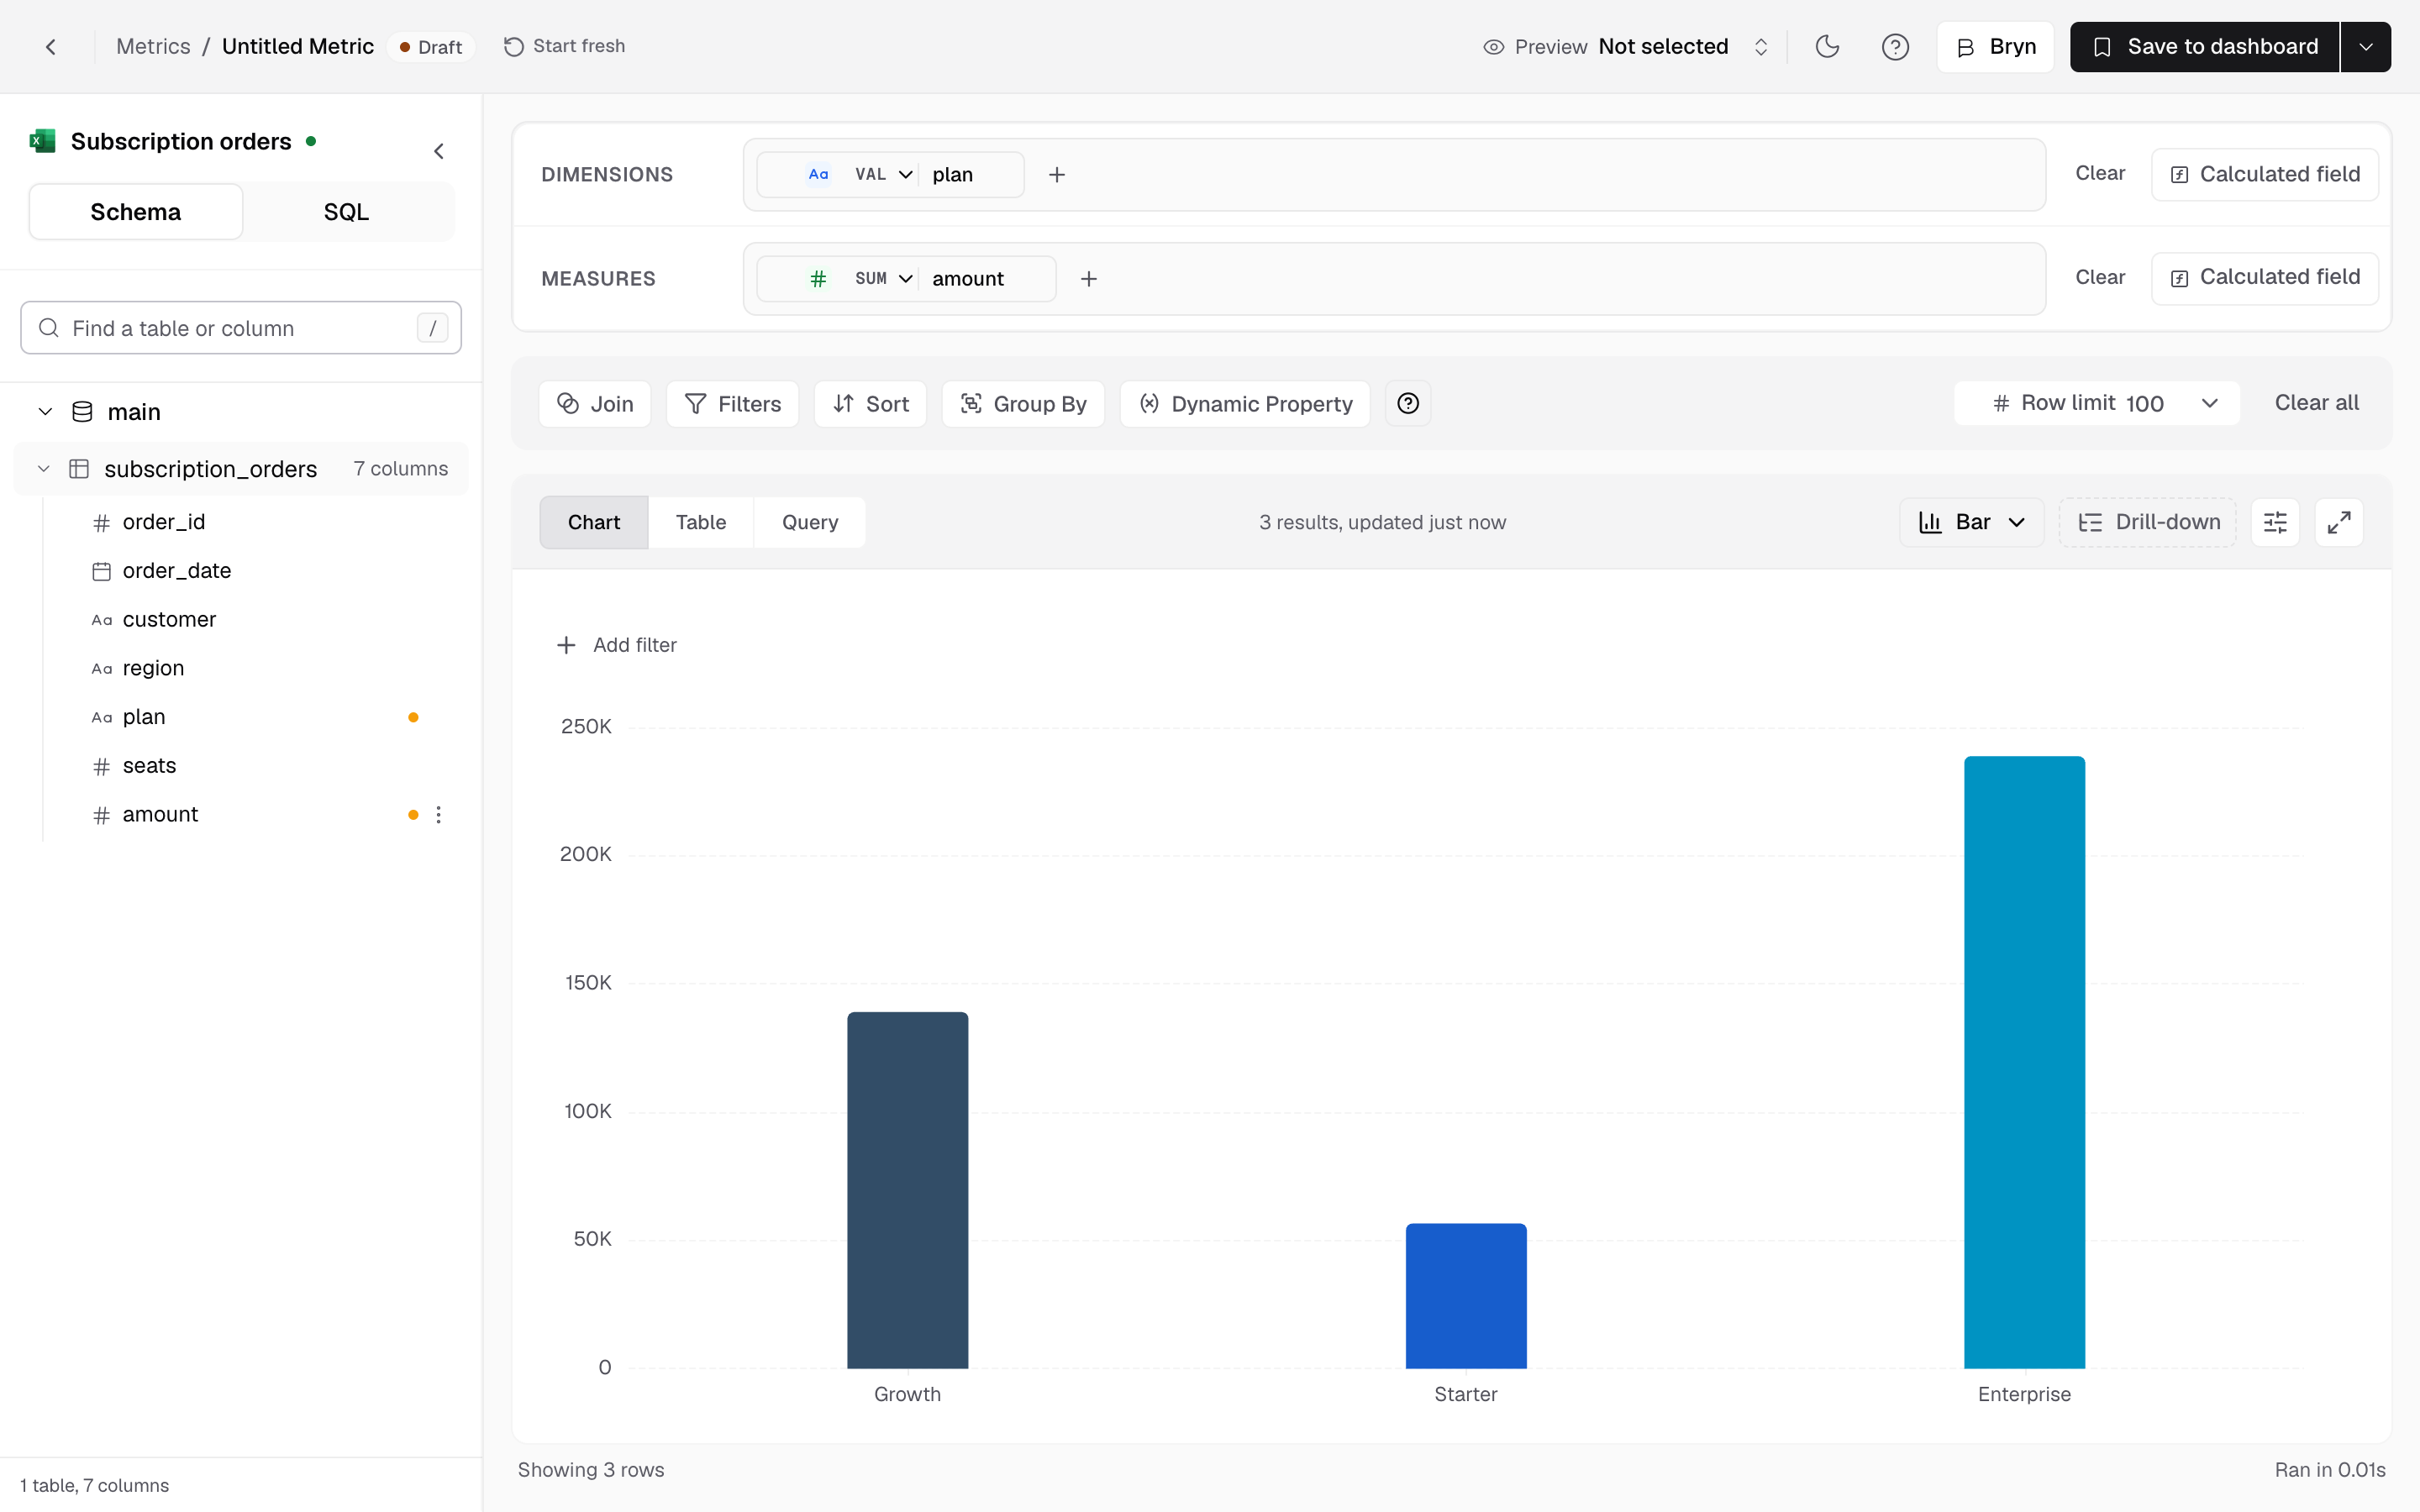
Use Chart, Table and Query to check the result. Use the chart type menu (it shows Bar for this example) to change the chart.
Or ask Bryn
- Select Bryn at the top right to open the panel.
- Type your question in plain words, for example
Monthly revenue trend as a line chart, and press Enter. - Bryn writes the SQL, runs it and shows the result. Select Apply chart to put it in the builder.
Bryn can only use the tables this workspace can read. For more, see Create a metric with Bryn.
Or write SQL
Select SQL above the schema list, write your query and select Run query. Then select Use results to chart it. See Create a metric using SQL.
Save it to a dashboard
- Select Save to dashboard. It turns on when the metric has a measure.
- Under Dashboard, pick a dashboard. If you have none, select New dashboard, enter a name such as
Revenue overview, and select Create. - Enter a Metric title, for example
Revenue by region. Databrain fills in the Metric ID from the title. - Select Save and add to dashboard.
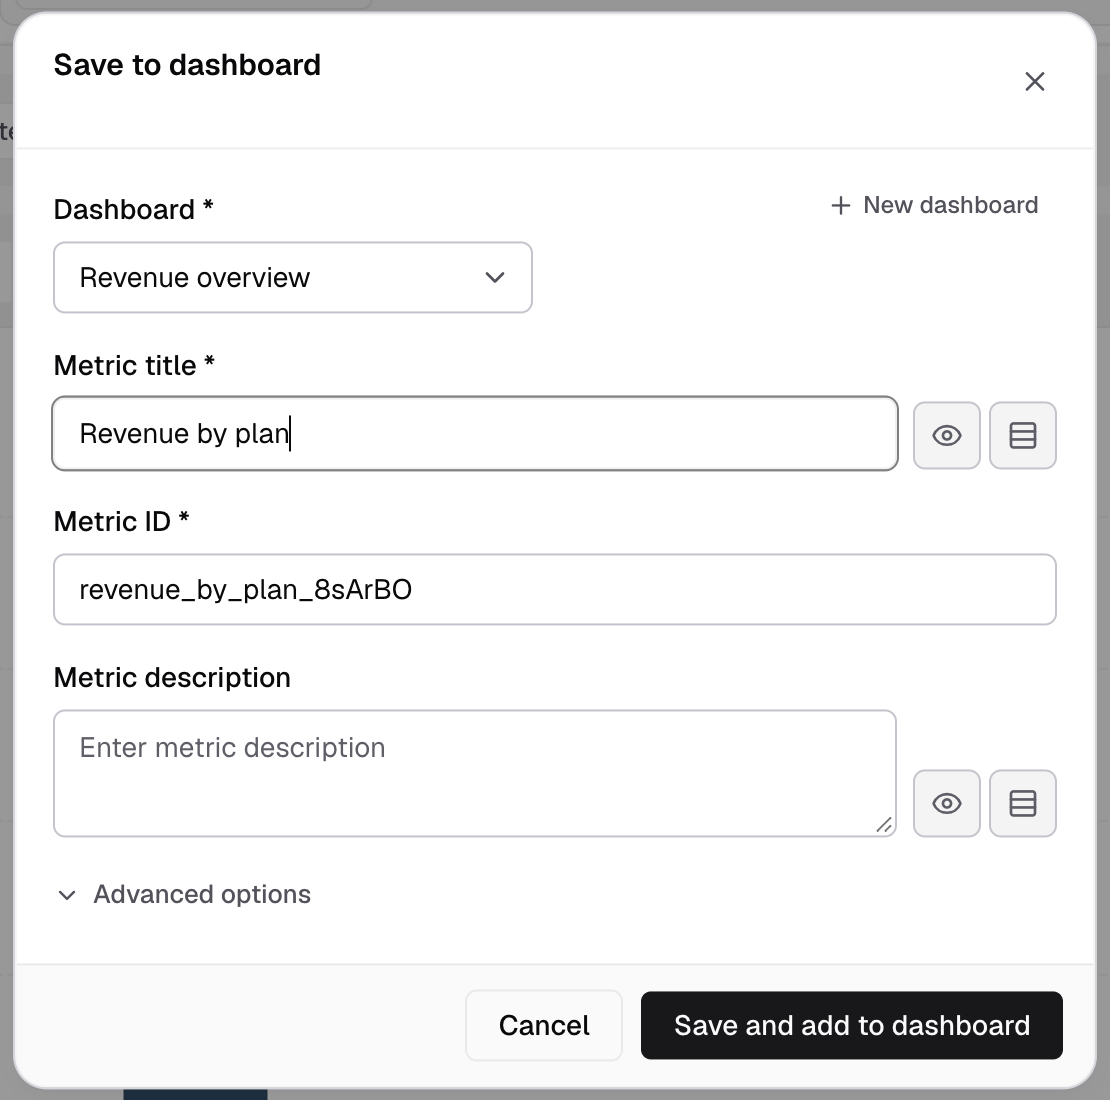
The dashboard opens with your metric on it. Next, customize the dashboard.
If something goes wrong
- Save to dashboard is greyed out. Add a measure first.
- The Schema list is empty. The datasource has no tables yet. Open Data Studio > Datasources, open the datasource and select Sync now.
- Bryn asks you to select a client. Pick a client, or All clients, under Preview at the top of the builder, then ask again.
- Bryn says “Setup required”. Your company’s AI provider has no credit left. Ask an Admin to check Settings > LLMs.