

Quick Start
Connect data and create a dashboard
Go from no data to a dashboard with your first chart in about five minutes.
Before you start
- You are an Admin, or your role lets you connect datasources.
- You have the connection details for your warehouse or database, or a CSV, XLSX or Parquet file.
1. Connect a datasource
- Go to Data Studio > Datasources and select Connect data source.
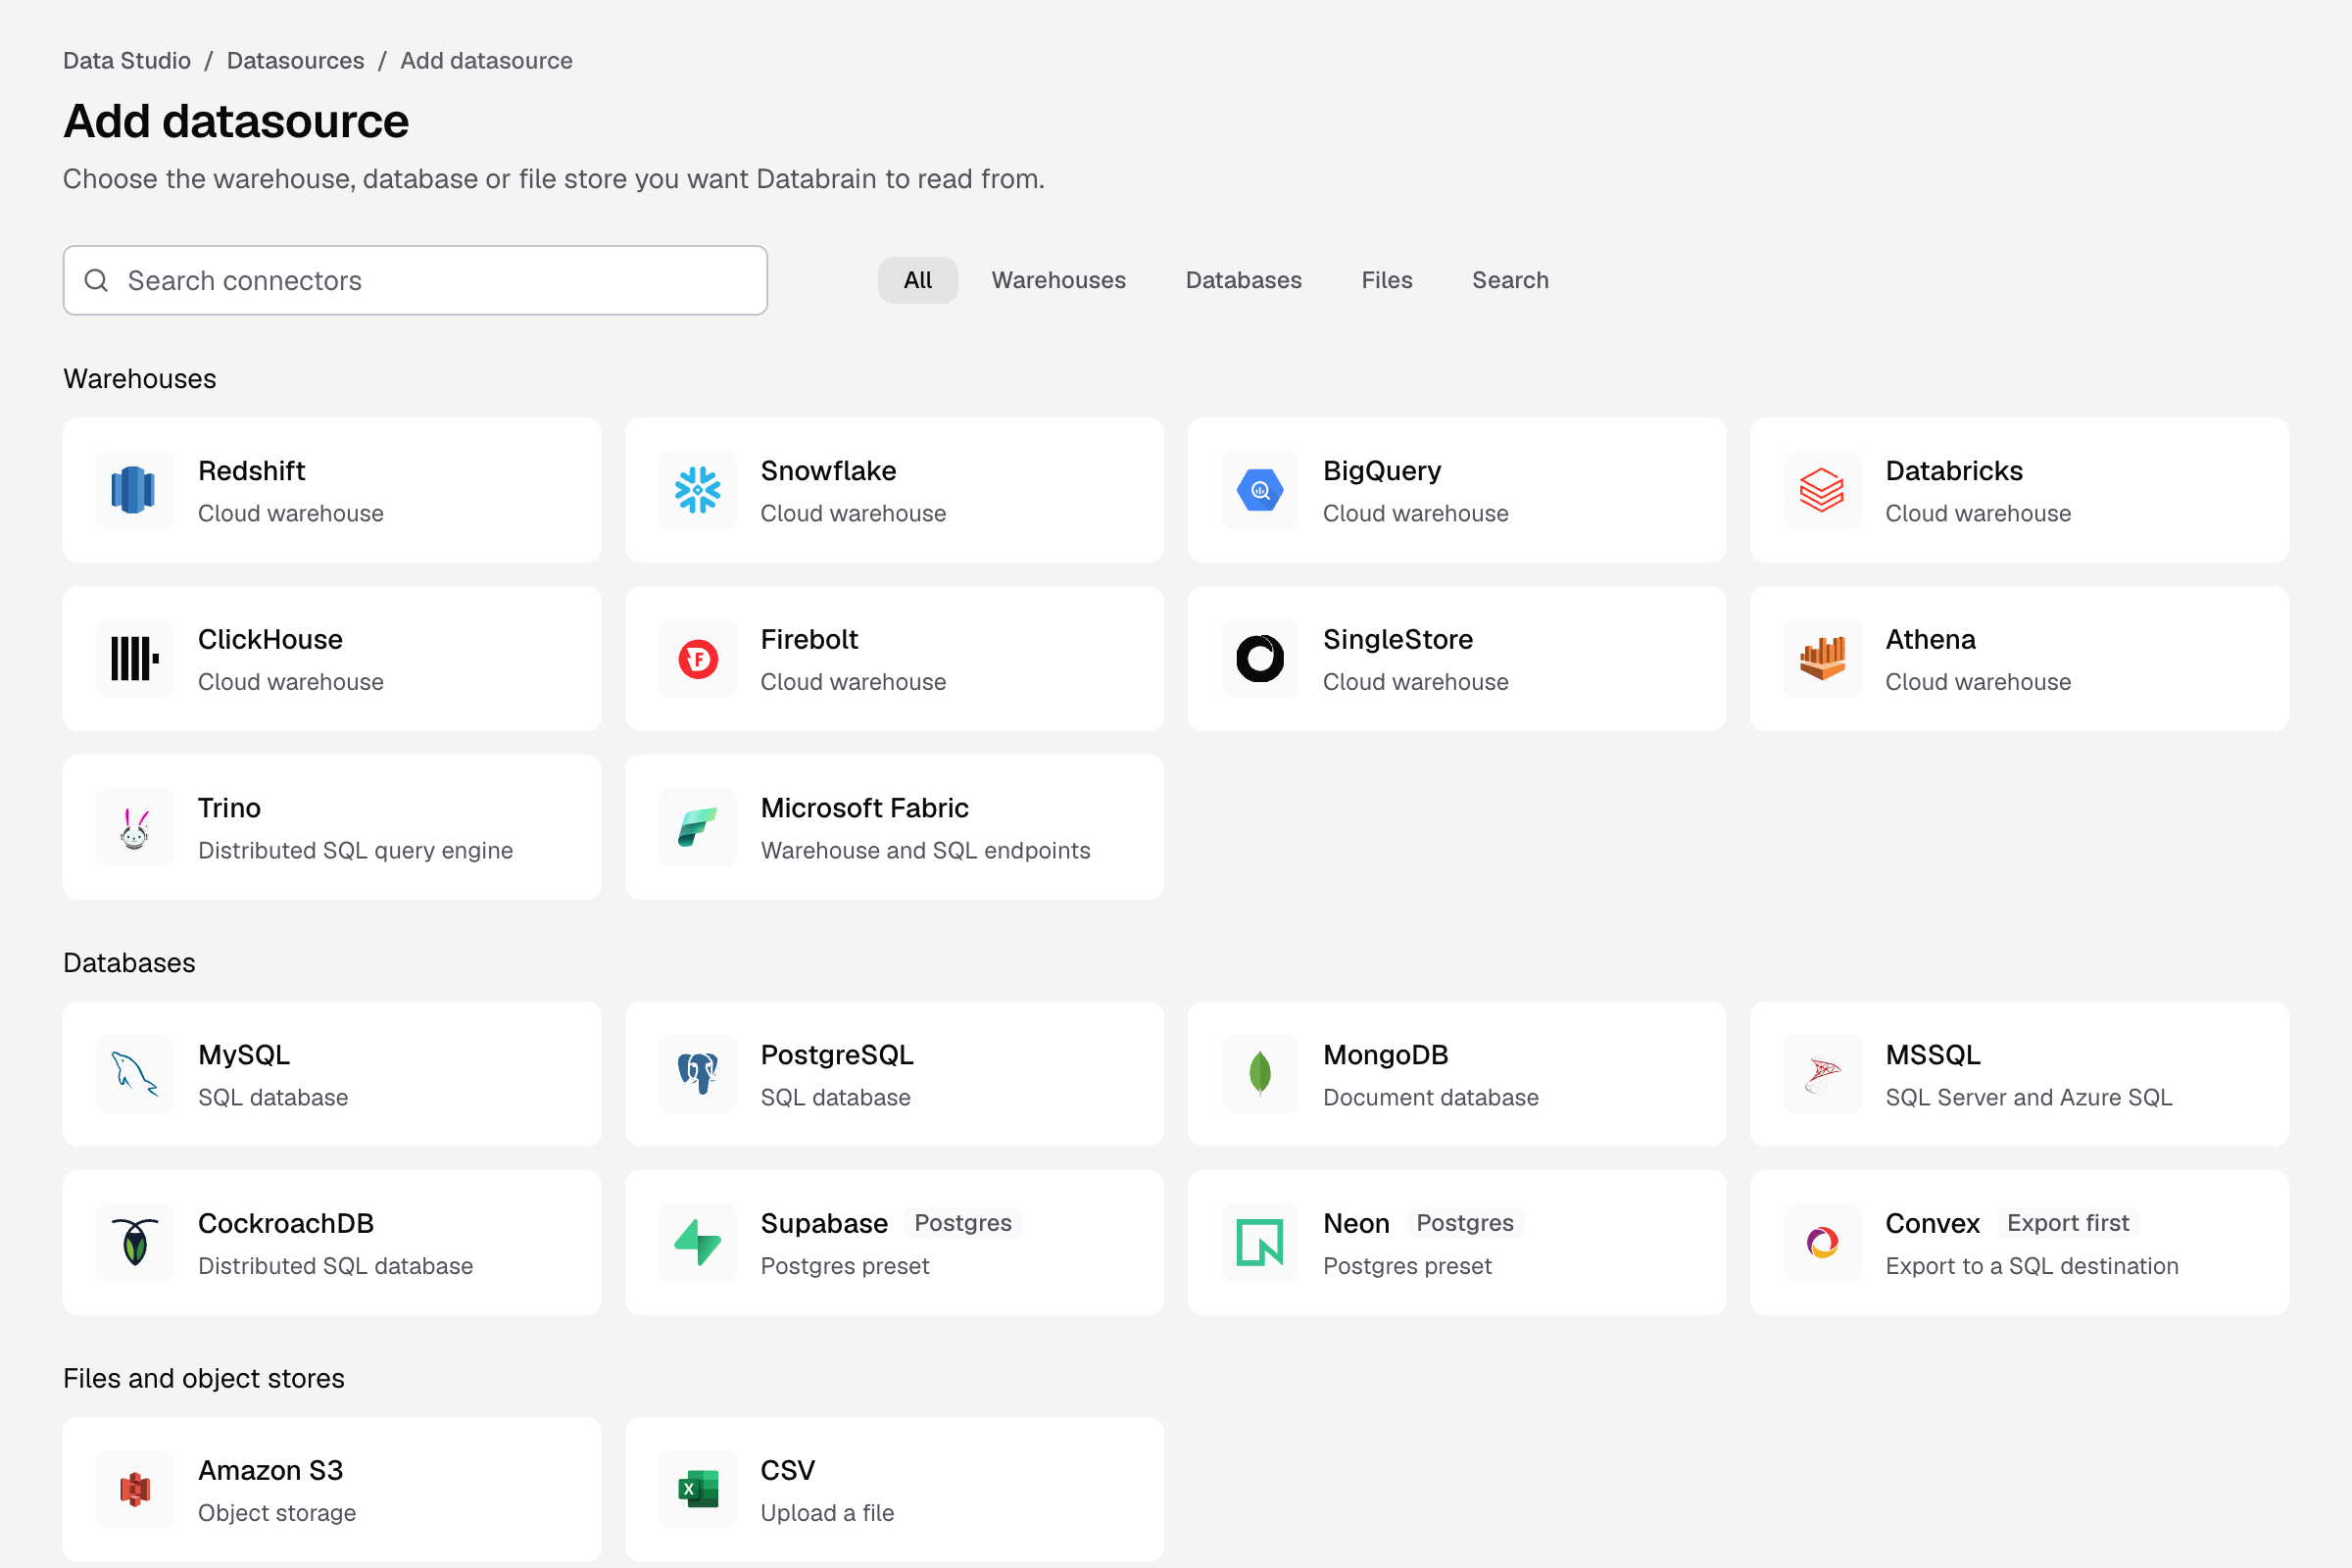
- On Add datasource, find your connector. Use Search connectors, or filter by Warehouses, Databases or Files.
- Select the connector, for example CSV.
- Enter a Datasource name your team will recognise, for example
Subscription orders. - Enter the connection details from the Setup guide on the right. For CSV, select Choose files and pick up to 5 files.
- Select Connect datasource. For a file, the button reads Upload and connect.
You see Step 3 of 3 and “name is connected”. For each connector’s fields, see the connector guides.
To try Databrain before you connect your own data, select Open sample workspace at the bottom of Add datasource.
2. Create a workspace
This video covers steps 2 and 3.
- On the connected page, select Create workspace.
- Enter a Workspace name, for example
Sales analytics. - Select Create workspace.
The workspace reads from the datasource you connected and opens on Home. To pick a datamart, several datasources or a private workspace instead, use Create workspace on Home. See Workspaces.
3. Create a metric and a dashboard
- In the workspace, select New metric.
- Open your table in Schema. Double-click a text column for Dimensions and a number column for Measures.
- Select Save to dashboard, then New dashboard. Enter a name and select Create.
- Enter a Metric title and select Save and add to dashboard.
Your dashboard opens with its first chart. For the details, see Create your first metric. Next, customize the dashboard.
Before you share with customers
A workspace does not keep one customer’s rows away from another’s. Set tenancy on the datasource (Tenancy tab) or on its model before you embed. See Configure tenants.
If something goes wrong
- Connect data source is missing. Your role cannot connect datasources. Ask an Admin.
- A CSV column shows as text, not a number. One row has a text value in that column. Fix the file and upload it again.
- The datasource shows Connection failed. Open it, check the details on the Connection tab, and select Sync now.