

SQL and Python
Build a metric with Python
Fetch data from an API with Python code and turn the result into a chart.
Before you start
- Your role has the Python View and Edit permissions. The default Editor and Developer roles have them.
- Every plan includes Python metrics.
- If your code calls an API with a key, store the key as a secret first.
Steps
-
In the metric builder, select the SQL tab above the schema list.
-
Set Query language to Python.
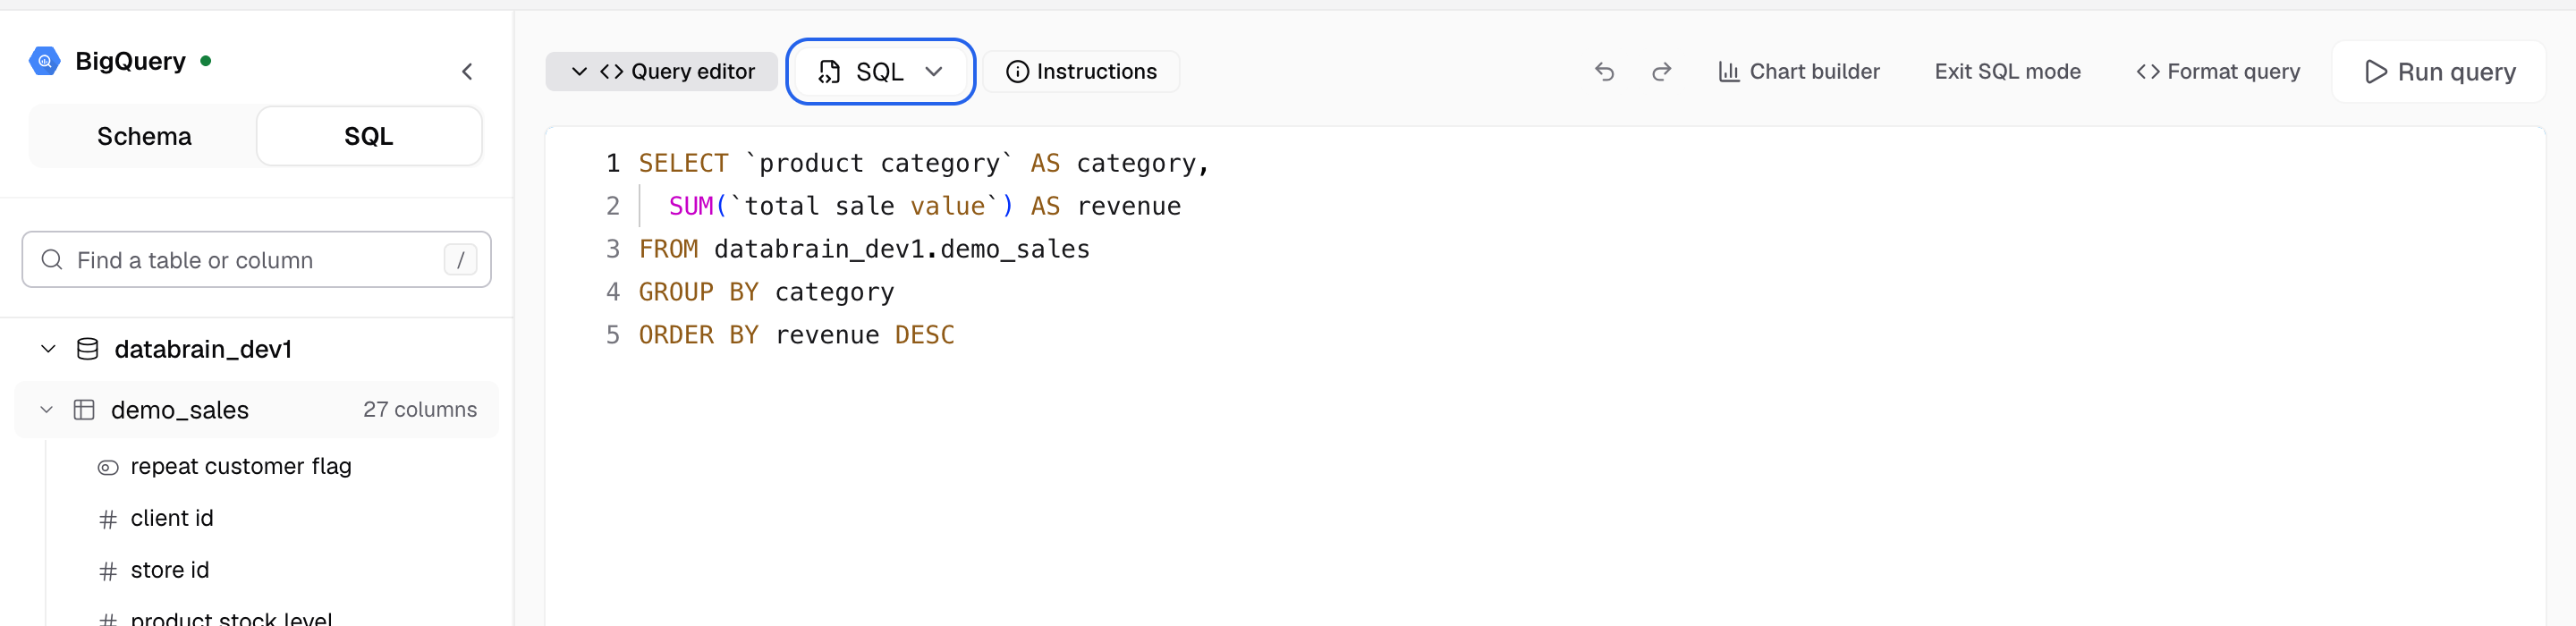
The language select switches the editor between SQL and Python. -
Write code that puts a list of dictionaries in a variable named
result:
url = secrets['secrets_BASE_URL']
rows = requests.get(f"{url}/orders", params={"client": client_id}, timeout=10).json()
result = [{"status": r["status"], "orders": r["count"]} for r in rows]-
Select Run code, or press Cmd+Enter (Ctrl+Enter on Windows).
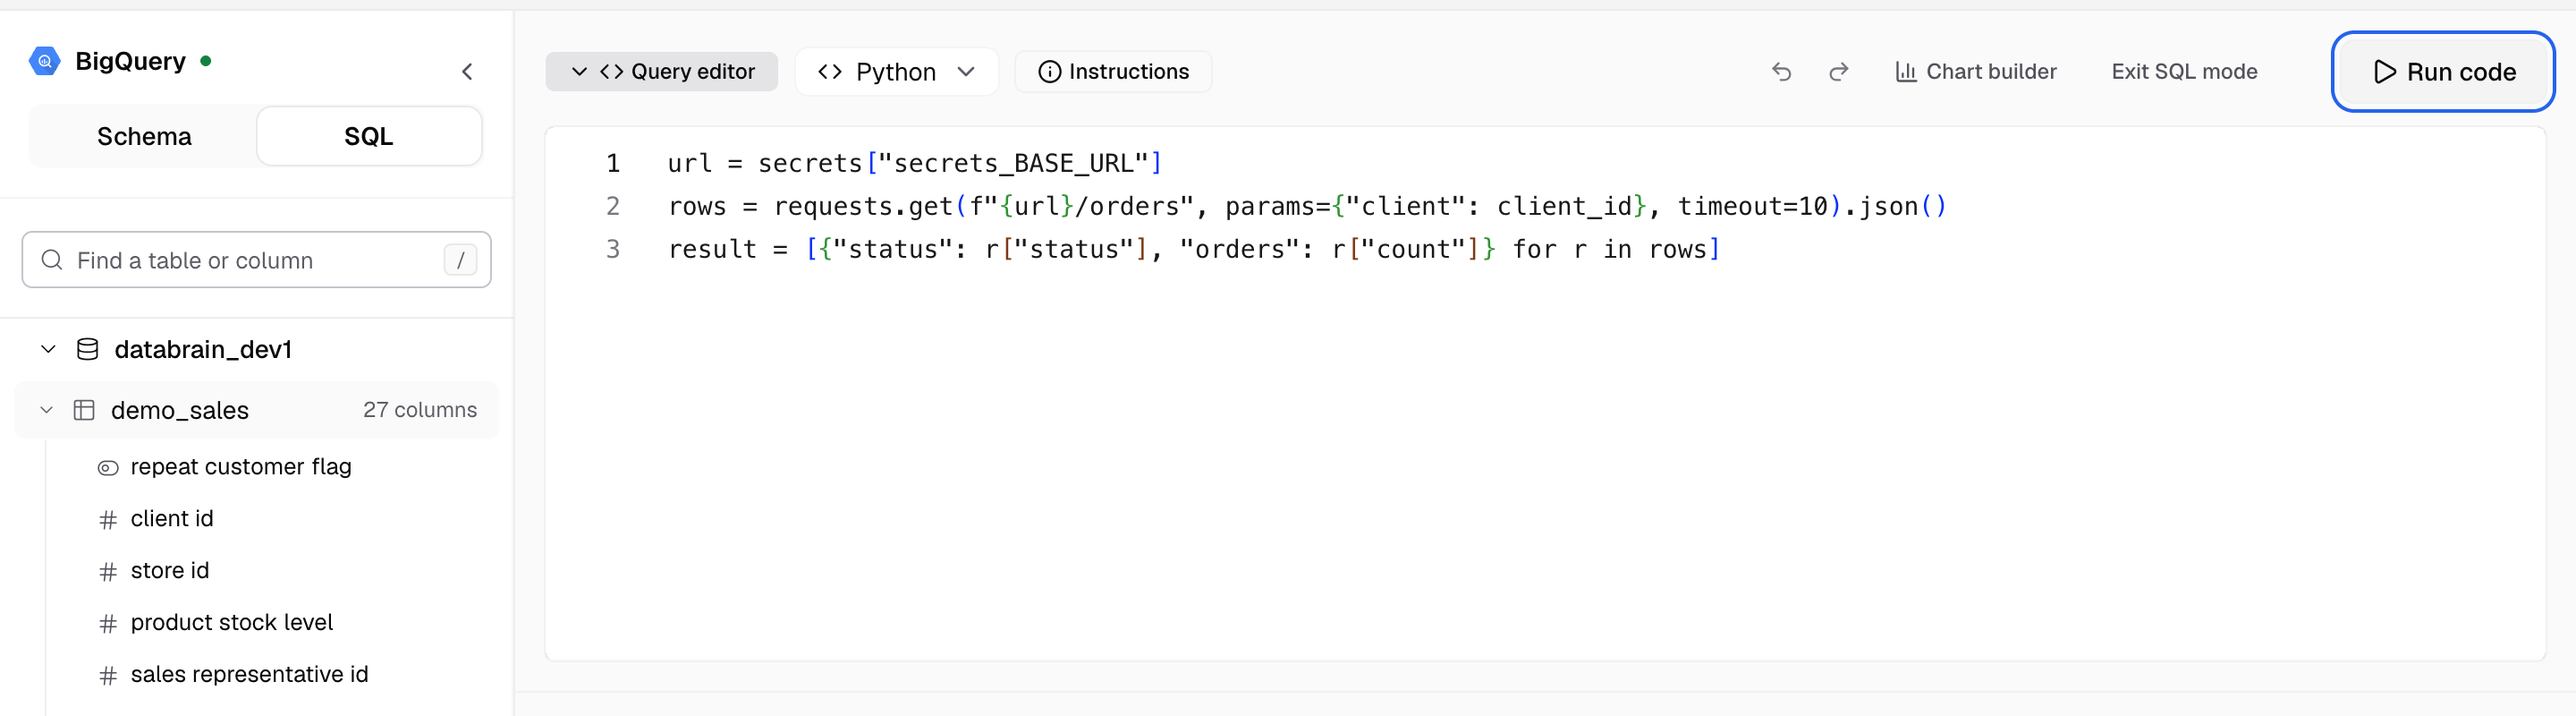
Run code runs your Python and shows the result rows. -
Check the result, then select Chart builder to pick the chart and save the metric.
Select Instructions in the editor for a short reminder of these rules.
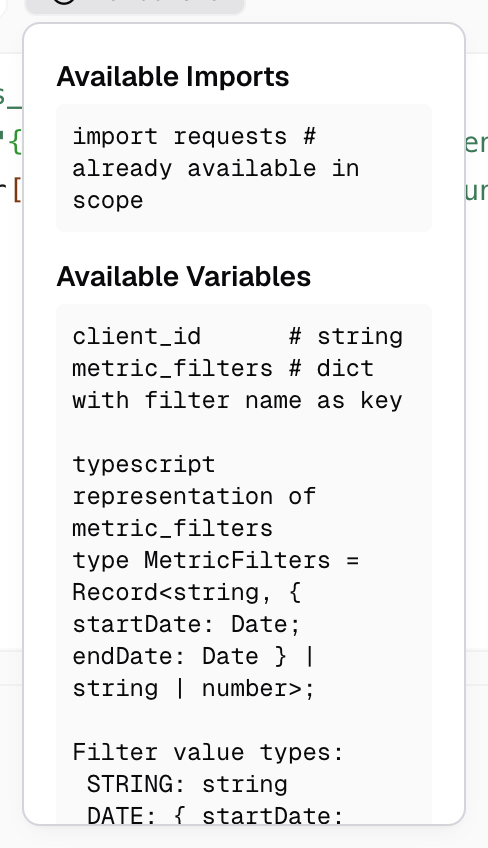
What your code gets
| Name | What it is |
|---|---|
requests | The Python requests library, already imported |
client_id | The client ID of the viewer, as a string |
metric_filters | The values of the metric’s variable filters, keyed by filter name |
secrets | Your company’s secrets, keyed by the name shown on the Secrets page, for example secrets_BASE_URL |
Only metric filters set to Variable Filter reach your code. See Python guidelines.
If something goes wrong
- Error: result should be an array of objects. Set
resultto a list of dictionaries, for example[{"key": "value"}]. - No result variable defined. Your code must assign
result. - Please use the given template, do not write restricted code. Your code used a blocked import or call. See the allowed imports in Python guidelines.