

Metric filters
Apply a metric filter
Add a filter that viewers use to change one metric, and choose the column it filters.
Add a filter that viewers use to change one metric, and choose the column it filters.
Before you start
- The metric is open in the builder and the preview has results. Create a metric
Steps
-
Above the chart, select Add filter, then Metric Filters.
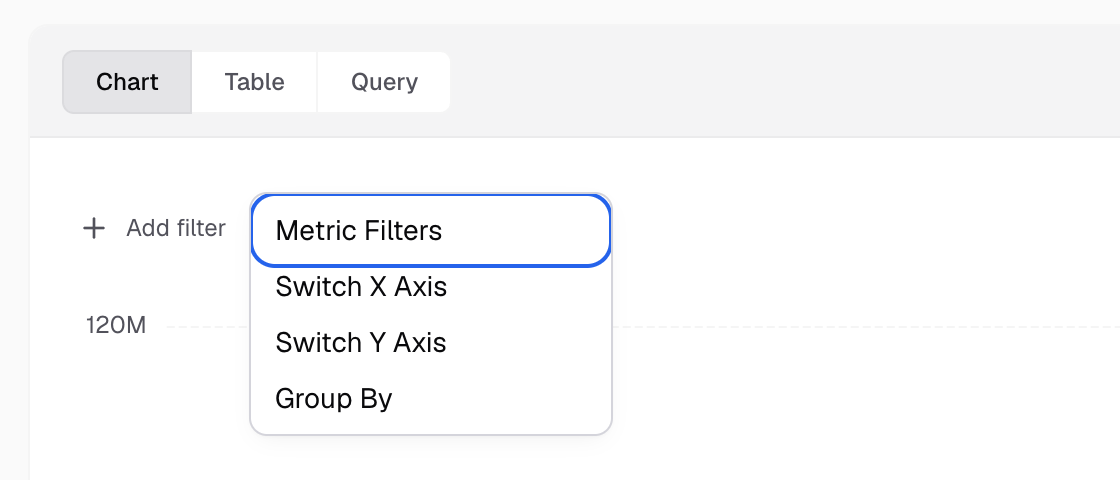
Add filter is above the chart; Metric Filters is the first item. -
In Filter Name, enter a name, for example
Region. This first step has no tabs. Until you fill the required fields, a note reads “Please complete all required fields to configure the filter.”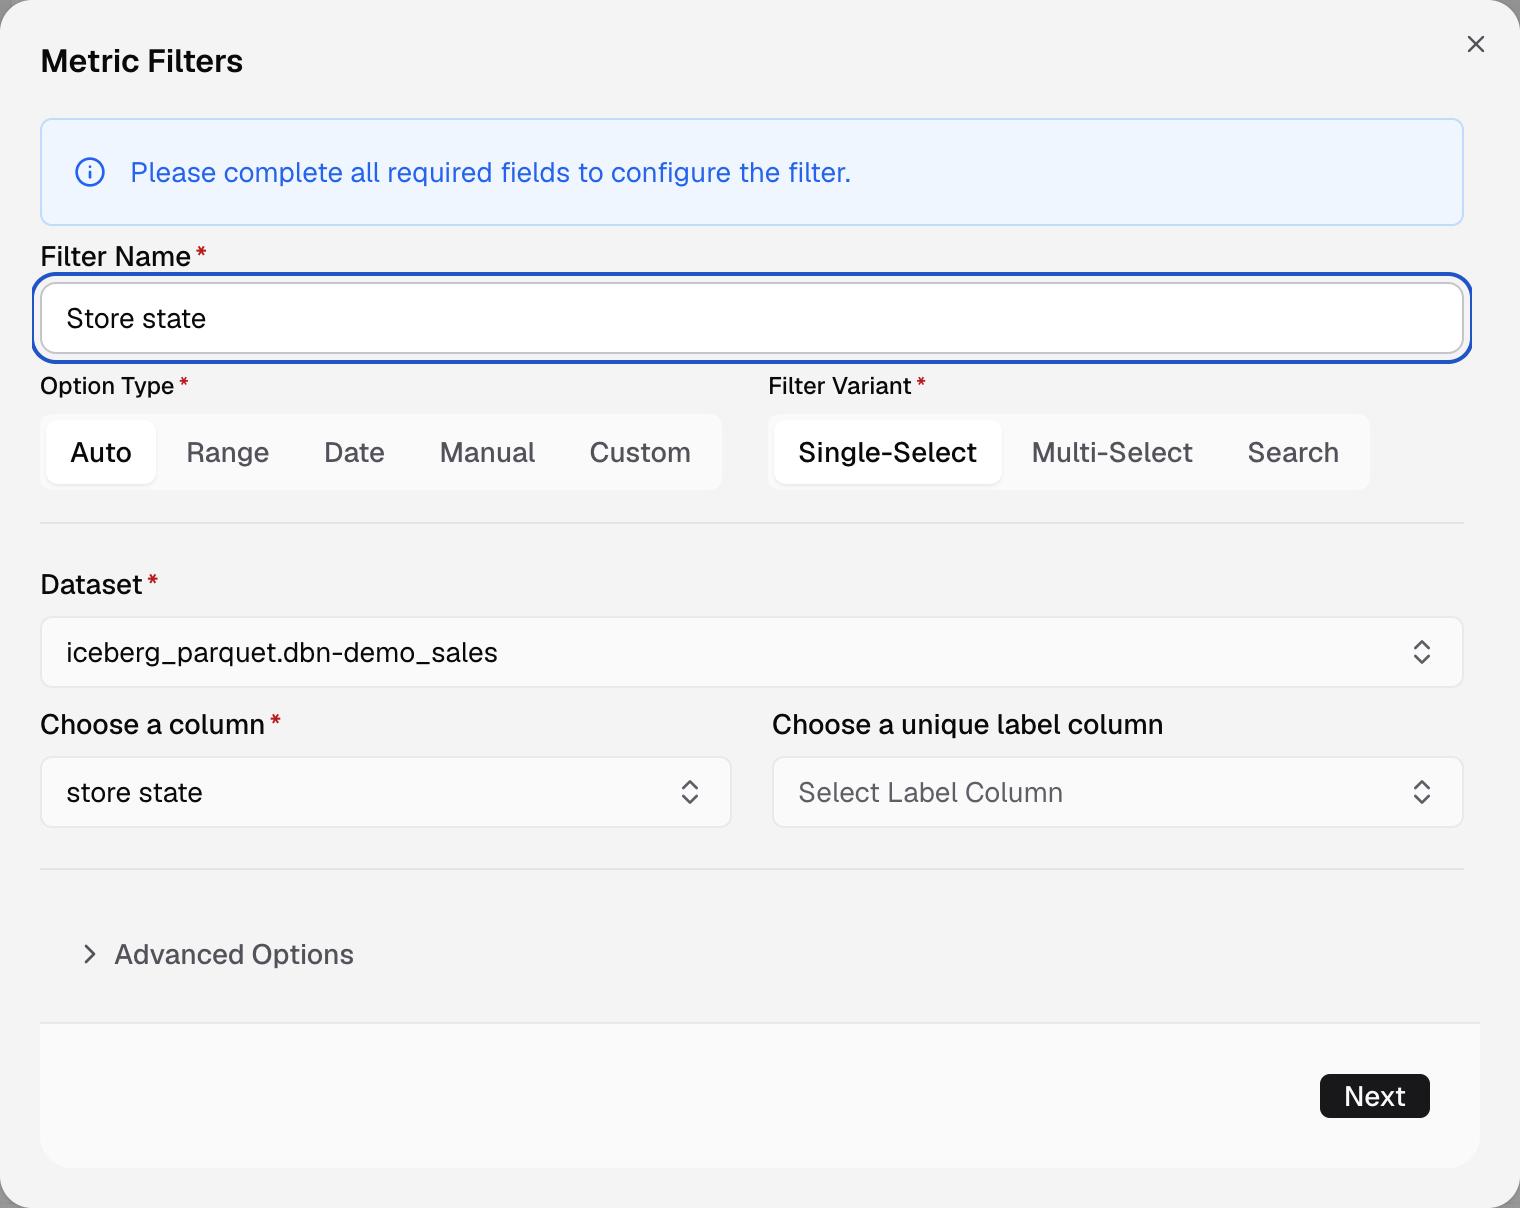
Metric Filters opens with Filter Name at the top. -
In Option Type, choose Auto.
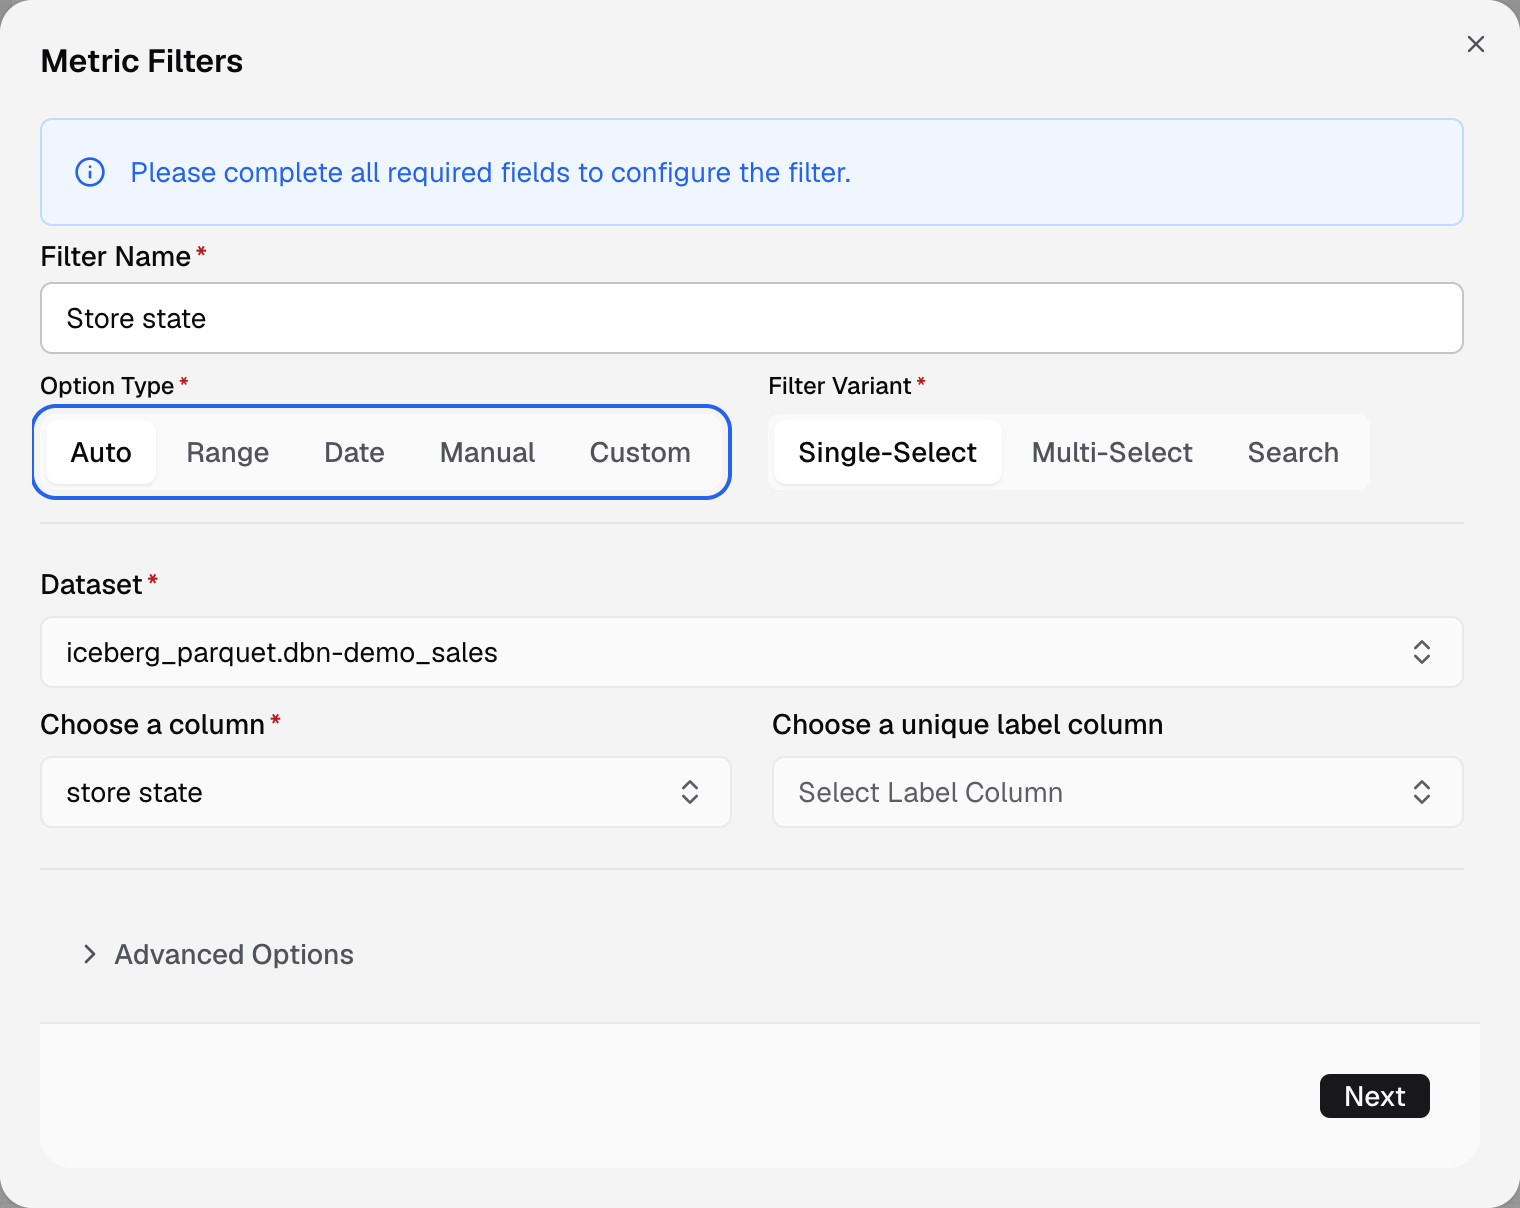
Option Type sets where the options come from. -
In Filter Variant, choose Single-Select, Multi-Select or Search.
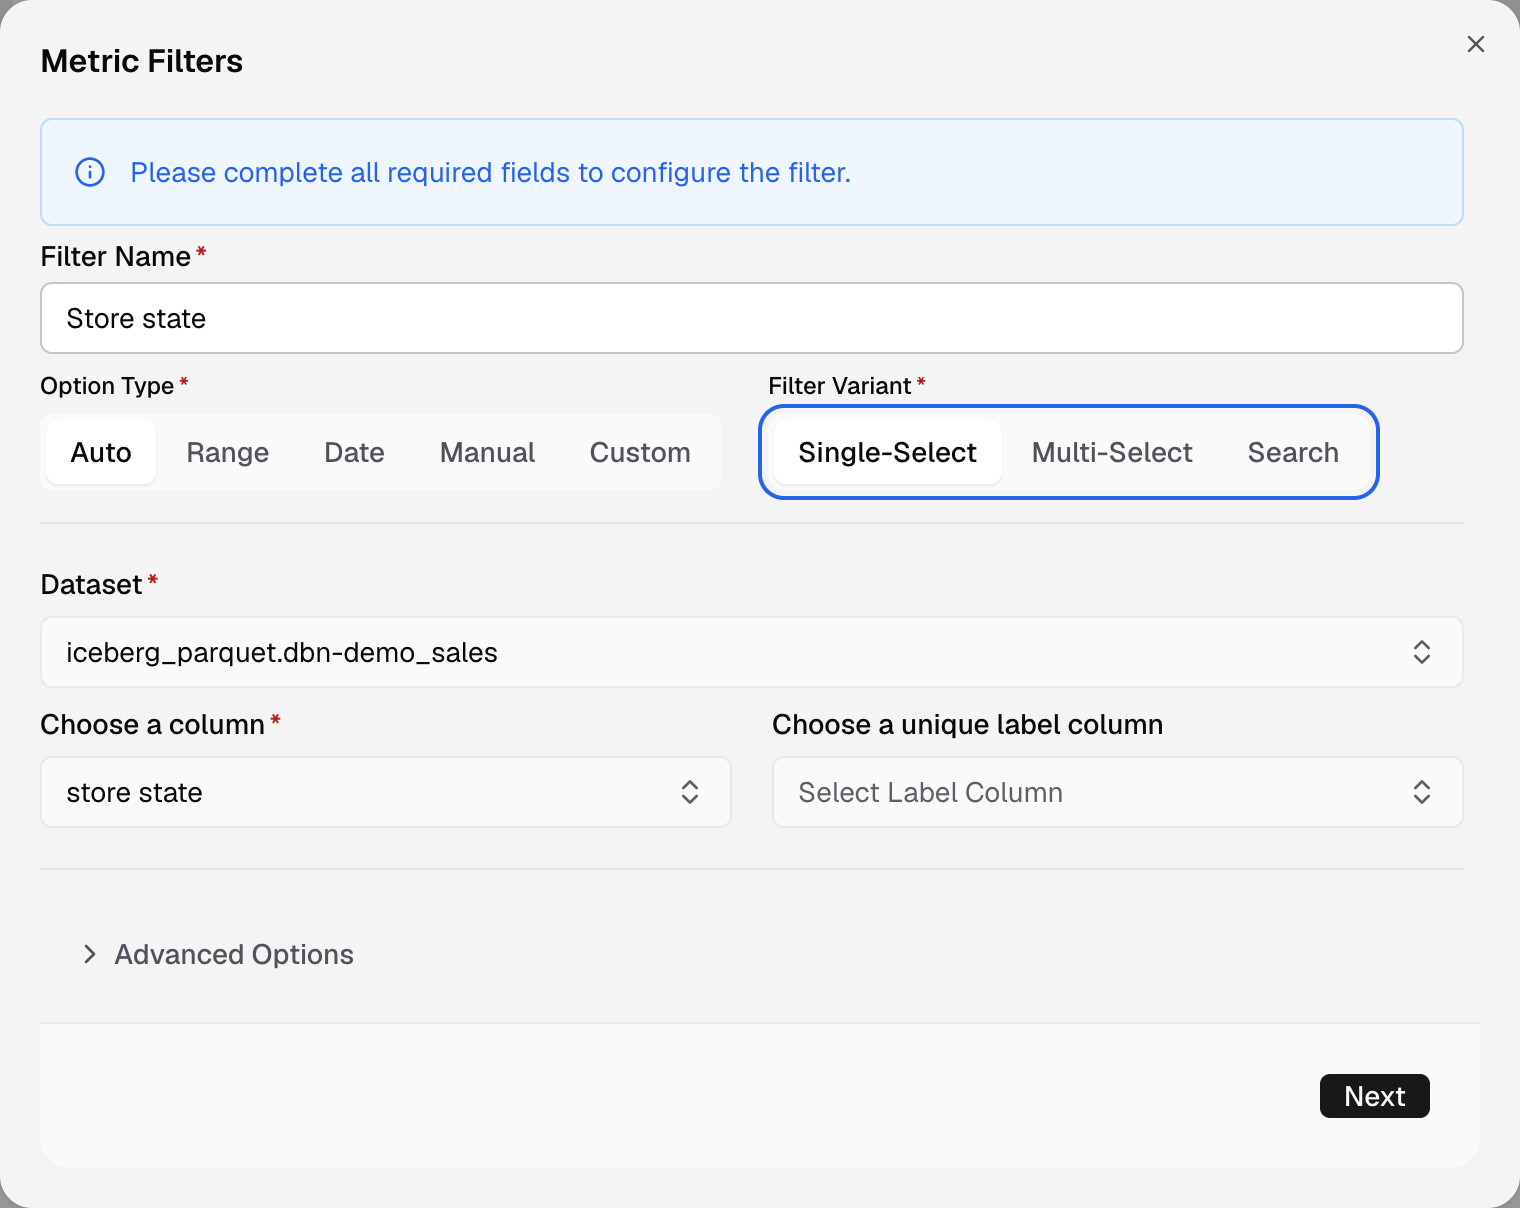
Filter Variant is to the right of Option Type. -
In Dataset, pick the table. In Choose a column, pick the column, for example
region.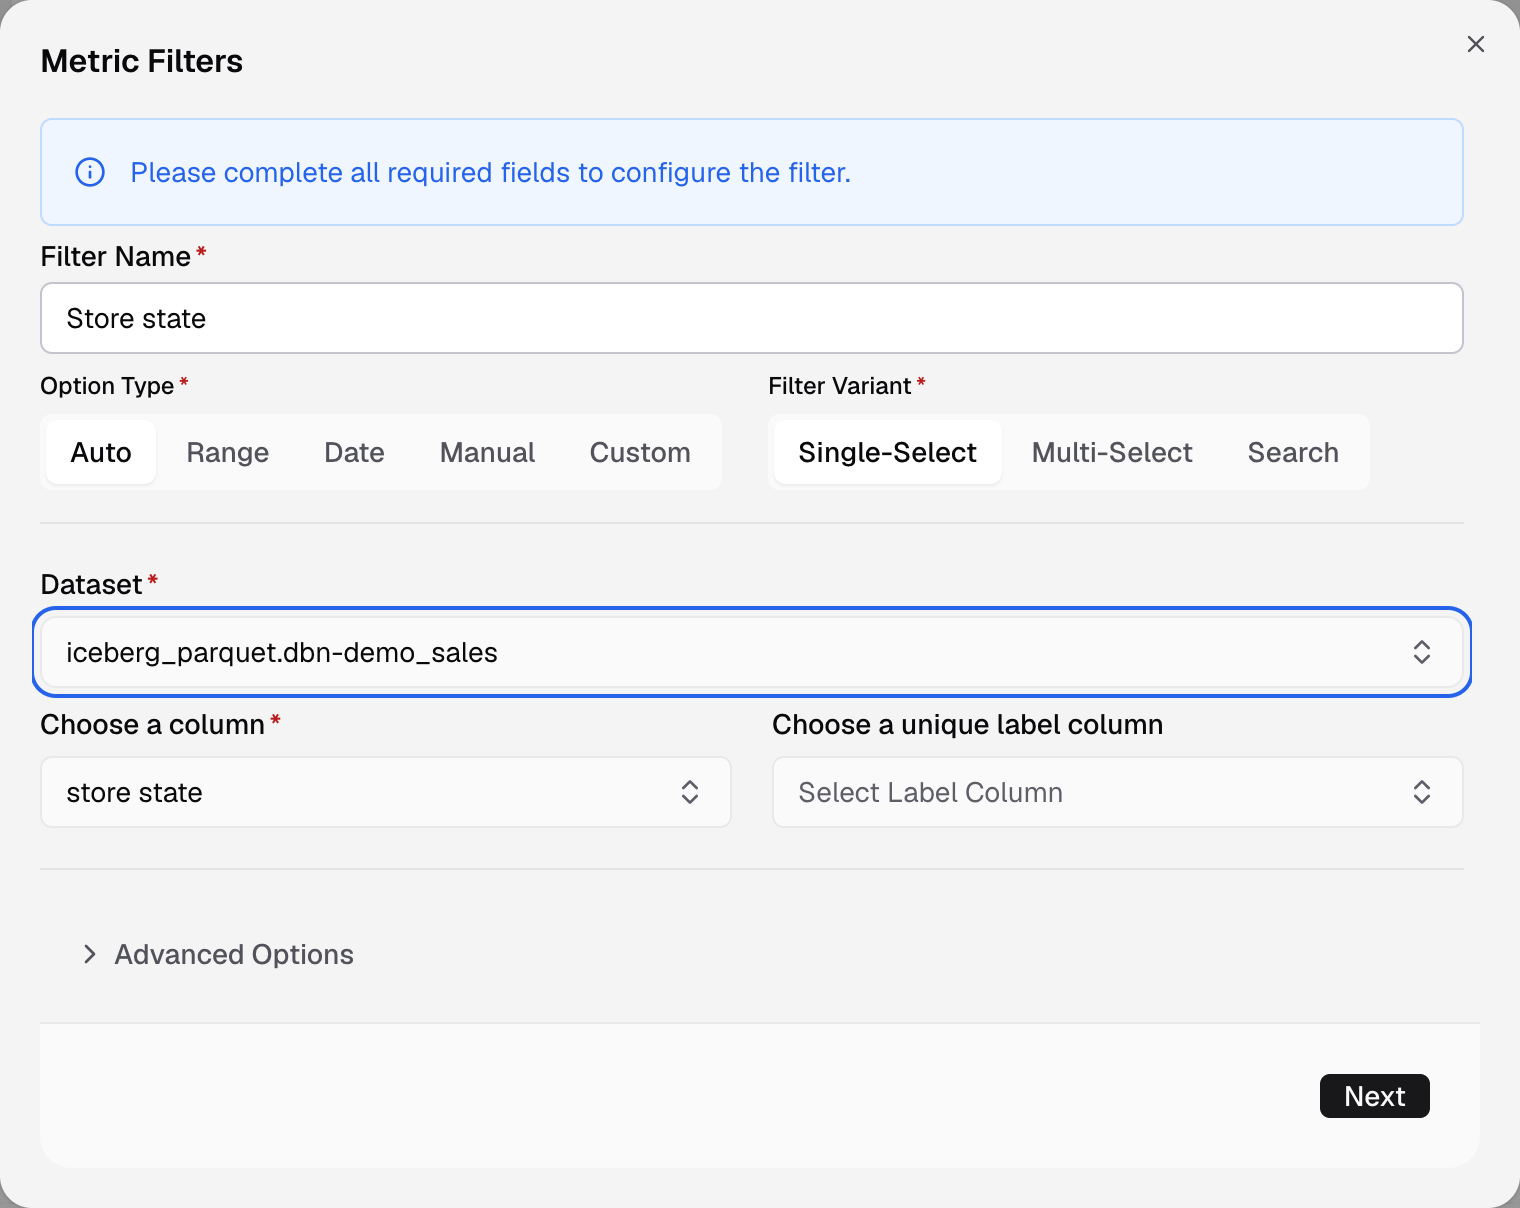
Pick the Dataset, then the column that holds the options. -
Select Next.
-
Keep Apply On. In Dataset, pick the table to filter.
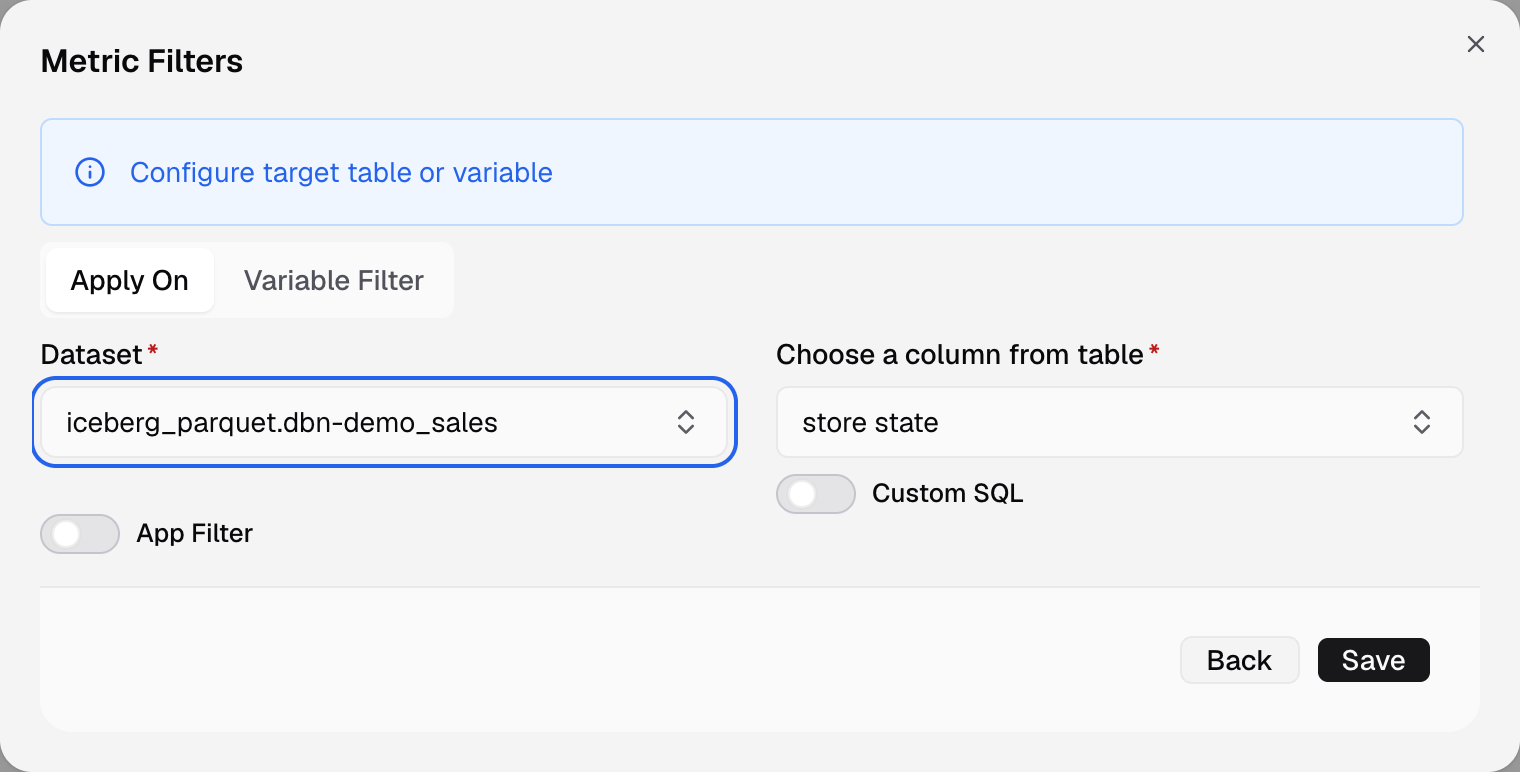
The second step: Apply On, then the dataset to filter. -
In Choose a column from table, pick the column to filter, for example
region.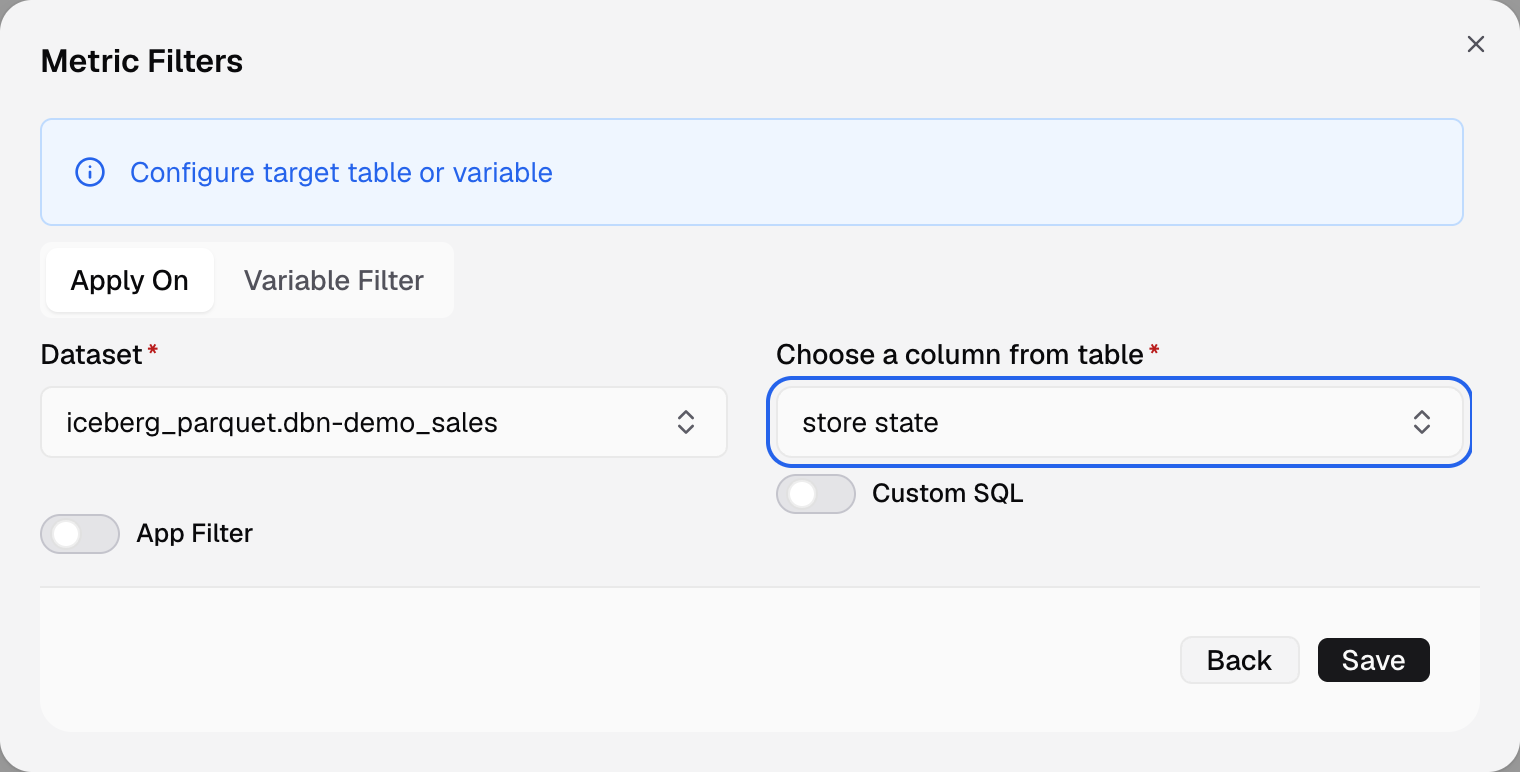
Pick the column the filter narrows. -
Select Save.
The filter is on the metric. When a viewer picks a value, the metric shows only the matching rows. Select Back at any time to change the options.
Option types
| Option Type | Where the options come from |
|---|---|
| Auto | The distinct values of a column. Use Choose a unique label column to show other text for each value. |
| Range | A number range from a low value to a high value. |
| Date | Dates. In Date Type, choose Date Selection or Preset Date. For Date Selection, choose Single Date, Date Range or Time Range in Selection Type. |
| Manual | Values you type. Choose string or number, enter each option value and an optional option label, and select Add Option. |
| Custom | A SQL query you write. Use SQL for filter options |
Filter Variant shows for text values. Search is only for Auto. Custom and Manual offer Single-Select and Multi-Select.
Advanced Options has more settings, such as Auto Select All Options and Allow Sorting. For Auto, turn on Show client scoped filter options and pick the client column to scope the options by client.
Where the filter applies
On the Apply On tab you choose what the selected value changes:
- Apply On filters a column. To filter more than one column, select Add Column and choose how to combine the columns. Turn on Custom SQL to filter on an expression, for example
LOWER("Category"). - Variable Filter puts the value into a placeholder in your SQL. Use a metric filter as a SQL variable
Turn on App Filter to let your app set the value in the guest token. Metric App Filter
If something goes wrong
- Option Type is greyed out. Enter a Filter Name first.
- please enter a valid name. Enter a name that no other filter on this metric uses.
- Two filters share a name. Rename one of them. Give each filter its own name.